Major centralized exchanges continued to dominate the crypto derivatives landscape in September 2026.
Looking at data from CoinMarketCap Research, the 11 exchanges tracked in this sample processed about $4.06 trillion in derivatives volume during the month. That made up 84.2% of their combined spot and derivatives activity.
Binance held a commanding lead with a 44.67% market share, followed by OKX at 17.49% and Bybit at 10.69%.
This report breaks down the September rankings, shifting market concentration, and why trading volume alone doesn’t tell the whole story when evaluating exchange performance.
Data period: September 1–30, 2026. Source: CoinMarketCap Research. These figures represent a specific 11-exchange sample rather than the entire global derivatives market.
September 2026 Market Overview
The tracked exchanges recorded the following activity:
| Metric | September 2026 |
|---|---|
| Derivatives trading volume | $4.065 trillion |
| Spot trading volume | $762.7 billion |
| Combined trading volume | $4.827 trillion |
| Derivatives share of combined volume | 84.2% |
| Derivatives volume growth (MoM) | +11.4% |
| Derivatives-to-spot volume ratio | 5.33x |
Derivatives easily remained the primary driver of trading activity across this group.
Interestingly, however, spot volume surged 30.7% from August—growing much faster than the 11.4% increase in derivatives.
Because of this rapid spot market recovery, the derivatives share of total trading actually shrank slightly, even as its absolute volume grew.
Crypto Derivatives Exchange Market Share Rankings
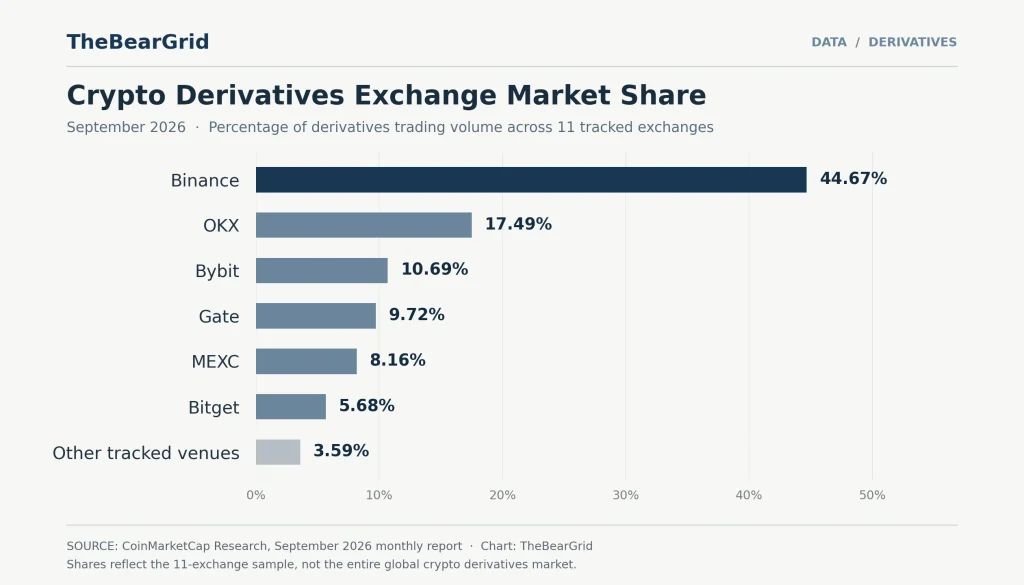
The following rankings measure each exchange’s contribution to total derivatives trading volume within CoinMarketCap’s 11-exchange sample.
| Exchange | Derivatives Volume | Market Share |
|---|---|---|
| Binance | $1,815.7B | 44.67% |
| OKX | $711.0B | 17.49% |
| Bybit | $434.5B | 10.69% |
| Gate | $395.1B | 9.72% |
| MEXC | $331.7B | 8.16% |
| Bitget | $230.9B | 5.68% |
| Other tracked venues | ~$145.8B | 3.59% |
| Total | $4,064.7B | 100.00% |
Source: CoinMarketCap Research, September 2026 Exchange Monthly Report. Other tracked venues are aggregated from the remaining exchanges in the sample. Small differences may occur due to rounding.
Binance Maintained a Dominant Position
Binance captured nearly 45% of all derivatives volume among the tracked platforms.
CoinMarketCap’s data shows its share climbed 0.96 percentage points from August, meaning Binance captured a disproportionate share of the month’s overall derivatives volume growth.
Of course, sheer size doesn’t automatically guarantee the best execution quality or risk controls for every individual trader, but the platform’s overwhelming market gravity is undeniable.
OKX and Bybit Ranked Second and Third
OKX held second place with $711 billion in volume, taking 17.49% of the tracked market.
Bybit followed at $434.5 billion, securing a 10.69% share.
When you add these top three together, they command almost 73% of the sample’s entire derivatives volume. It’s a stark reminder of just how heavily concentrated trading activity is at the very top of the market.
Gate Gained Share While MEXC Declined
Further down the leaderboard, Gate edged out MEXC, securing a 9.72% share compared to MEXC’s 8.16%.
Gate managed a solid 2.19 percentage point jump from August, while MEXC shed 3.61 points.
This shift highlights how volatile exchange rankings can be outside the top three—though it takes more than a single month of data to confirm a permanent change in the competitive landscape.
How Concentrated Was Derivatives Trading?
Looking at market concentration offers a different angle on the exchange ecosystem.
Beyond the top three controlling nearly 73% of the activity, the top six platforms accounted for over 96% of the volume.
CoinMarketCap’s Herfindahl-Hirschman Index (HHI)—a standard economic measure of market concentration—ticked up from approximately 2,550 in August to 2,610 in September.
In short, even as the broader market recovered, trading activity became more concentrated among the largest venues.
Keep in mind that these figures reflect the specific dataset and shouldn’t be treated as a universal measure for every global venue.
Derivatives Trading vs. Spot Trading
While derivatives are still the heavyweight, the two markets moved at very different speeds in September.
The 30.7% month-over-month spike in spot volume substantially outpaced the 11.4% growth in derivatives.
Consequently, the ratio of derivatives to spot trading volume dropped from 6.25x to 5.33x.
This doesn’t mean traders are abandoning leverage. Rather, it points to a stronger recovery in spot trading activity during the month.
It’s a good reminder to weigh both absolute volume and relative market share when assessing exchange activity.
What Derivatives Market Share Does Not Tell Us
Trading volume is a useful baseline metric, but it leaves out some critical nuances of market quality.
Trading Volume Is Not the Same as Liquidity
A high volume figure on a leaderboard doesn’t guarantee deep order books or cheap trading.
Real liquidity involves tight bid-ask spreads, minimal slippage, and execution resilience during periods of extreme market volatility.
Volume and Open Interest Measure Different Things
Volume counts how much was traded over a period; open interest measures the outstanding derivatives positions at a particular point in time.
An exchange could see massive daily turnover from high-frequency trading without actually holding a large share of the market’s outstanding positions.
That’s why the two metrics should be analyzed side by side.
If you’re new to the mechanics behind these contracts, our guide to perpetual futures explains leverage, funding payments, and liquidation.
Reported Market Share Depends on Data Coverage
Every dataset has boundaries.
The September figures used here cover 11 specific centralized exchanges—meaning they exclude decentralized perpetual platforms, regulated futures markets, and other unlisted venues.
These percentages represent a snapshot of this specific sample, not the absolute global market.
Data Sources and Methodology
This report is based on the September 2026 Exchange Monthly Report published by CoinMarketCap Research.
The methodology is as follows:
- Measurement period: September 1–30, 2026
- Primary metric: Monthly derivatives trading volume in USD
- Coverage: 11 exchanges tracked by CoinMarketCap Research
- Market share calculation: Individual exchange derivatives volume divided by total derivatives volume across the tracked group
- Dataset total: Approximately $4.0647 trillion
The tracked group consists of Binance, OKX, Bybit, Gate, MEXC, Bitget, KuCoin, Coinbase/Deribit (grouped together in this dataset), HTX, Upbit, and Crypto.com.
It’s worth noting that differing aggregation practices, instrument coverage, and exchange-reported data can affect reported volumes.
Results from different data providers shouldn’t be mixed without first reconciling their methodologies.
This article is a historical snapshot, not a live market feed.
FAQ
Which crypto exchange had the largest derivatives market share in September 2026?
Binance took the top spot in CoinMarketCap’s 11-exchange sample, handling 44.67% of the tracked derivatives volume.
Does the ranking include all crypto derivatives exchanges?
No. It only covers the 11 exchanges selected for the underlying CoinMarketCap Research dataset. Unlisted platforms aren’t factored into these percentages.
Is derivatives trading volume the same as open interest?
No. Volume measures how much trading happened over a specific period, whereas open interest measures outstanding derivatives positions at a particular point in time.
Does higher trading volume mean an exchange is better for traders?
Not always. While high volume can be a useful indicator of trading activity, traders also need to check the platform’s actual liquidity depth, trading costs, risk management rules, and product availability.
Summary
September 2026 saw crypto derivatives volume climb, but the activity remained heavily concentrated at the top.
Binance maintained its firm grip on the tracked market with a 44.67% share, followed by OKX and Bybit in second and third place. We also saw some mid-tier reshuffling as Gate gained ground while MEXC lost momentum.
Interestingly, spot trading bounced back much faster than derivatives, reducing the derivatives-to-spot volume ratio.
Ultimately, while volume-based market share tells us where the highest turnover is happening, it doesn’t give us the full picture of liquidity, open positions, or trading conditions.
To truly gauge an exchange’s competitive position, metrics like open interest and order-book depth are just as crucial.
Disclaimer: This article is intended for informational and educational purposes only. It does not constitute financial or investment advice. Market-share figures are based on third-party data and may differ across providers.