Bitcoin prices are rising, trading volume is increasing, and open interest is climbing at the same time.
Does that mean more traders are opening leveraged long positions?
Not necessarily.
Open interest (OI) is one of the most widely followed indicators in crypto derivatives markets. Traders use it to evaluate changes in outstanding futures exposure, assess market participation, and identify conditions that may increase volatility.
But open interest is also frequently misinterpreted.
A rising OI figure does not automatically mean bullish positioning is increasing. A decline does not necessarily indicate that traders are abandoning the market. And sometimes, the reported dollar value of open interest changes even when the underlying number of outstanding contracts remains unchanged.
Understanding these distinctions is essential for interpreting crypto futures markets accurately.
Table of Contents
What Is Open Interest?
Open interest is the total amount of outstanding futures or options contracts that have not been closed or settled.
In crypto markets, OI is commonly used to track activity in Bitcoin and Ethereum perpetual futures.
A perpetual futures contract allows traders to maintain leveraged long or short exposure without a scheduled expiration date.
Every futures contract involves two opposing sides:
- A trader holding a long position.
- A trader holding a short position.
These positions exist together as two sides of the same contract.
Under the standard single-sided counting convention, each outstanding contract contributes once to open interest—not once for the long and again for the short.
This distinction matters because OI does not measure the difference between the total number of longs and shorts.
For every outstanding futures contract, there is corresponding long and short exposure.
Open interest tells us how much contract exposure remains outstanding, not which side of the market will win.
For a broader introduction to the instruments involved, see What Are Perpetual Futures?.
How Open Interest Changes
Open interest changes when outstanding contracts are created or extinguished.
However, not every futures transaction changes OI.
The outcome depends on whether the buyer and seller are opening new positions or closing existing ones.
Four Trading Scenarios
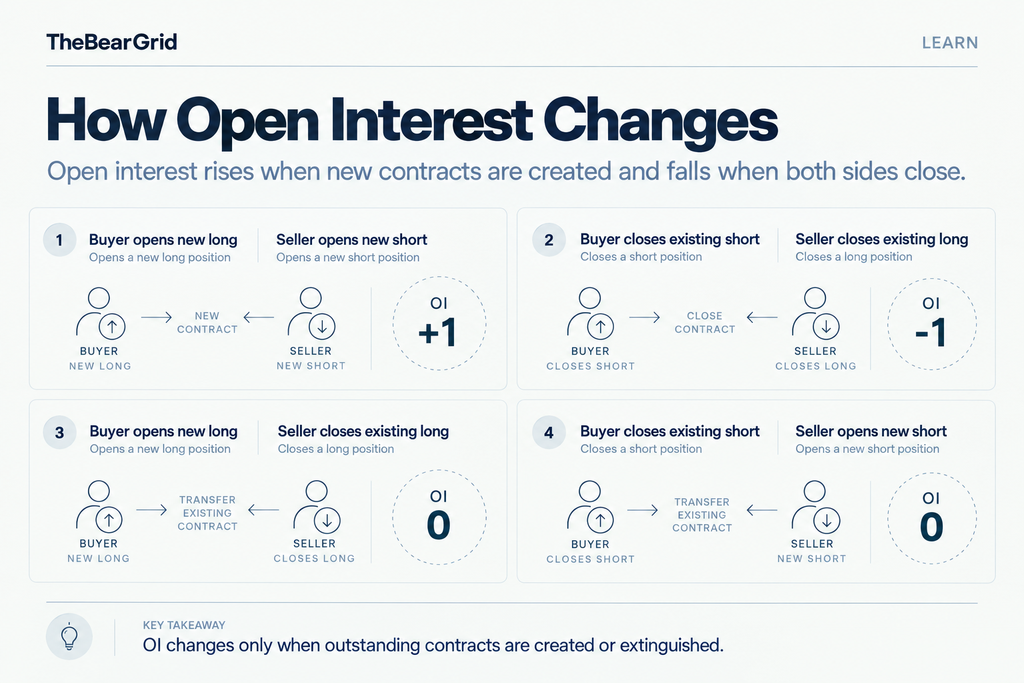
Consider a simplified futures market in which each transaction involves one contract.
| Buyer action | Seller action | OI change |
|---|---|---|
| Opens a new long | Opens a new short | +1 |
| Closes an existing short | Closes an existing long | -1 |
| Opens a new long | Closes an existing long | 0 |
| Closes an existing short | Opens a new short | 0 |
In the first scenario, both counterparties establish new exposure. One new outstanding contract is created, so OI increases by one.
In the second scenario, both counterparties close existing exposure. One outstanding contract is extinguished, so OI decreases by one.
In the remaining scenarios, an existing position effectively changes hands. One trader enters while another exits, leaving the total outstanding contract count unchanged.
This explains why trading activity can increase sharply without a corresponding increase in open interest.
A Simple Open Interest Calculation
Suppose a BTC perpetual futures market begins with 100 outstanding contracts.
During the next observation period:
- 30 new contracts are created through transactions in which both sides open.
- 20 contracts are extinguished through transactions in which both sides close.
- Other transactions transfer existing exposure between traders without changing OI.
The resulting open interest is:
Ending OI = Starting OI + Newly Created Contracts − Extinguished Contracts
100 + 30 − 20 = 110 contracts
OI has increased by 10%, indicating that more contracts remain outstanding than at the beginning of the period.
However, this increase does not tell us whether the price will rise or fall.
It also does not reveal how much fresh cash collateral entered the exchange.
OI measures outstanding contracts, not cash deposits or net directional investment flows.
Open Interest vs. Trading Volume
Open interest and trading volume measure different aspects of derivatives activity.
Trading volume measures how much trading occurred.
Open interest measures how much contract exposure remains outstanding.
Consider a market where two traders establish 10 new futures contracts.
The transaction generates trading volume of 10 contracts and increases OI by 10.
Later, those positions are fully closed through another transaction involving 10 contracts.
That creates another 10 contracts of trading volume, while OI returns to zero.
Over the two transactions:
- Total trading volume: 20 contracts.
- Ending open interest: 0 contracts.
The market experienced trading activity, but no outstanding positions remained at the end of the example.
This is why a high-volume market does not necessarily have high or growing open interest.
What Each Metric Reveals
| Metric | What it measures | Main analytical use |
|---|---|---|
| Trading volume | Contracts traded during a period | Market activity and turnover |
| Open interest | Outstanding contract exposure at a point in time | Changes in active derivatives exposure |
| Funding rate | Periodic payment mechanism between long and short positions | Cost and pressure of maintaining perpetual exposure |
| Order-book depth | Available orders near market prices | Execution liquidity |
These indicators are related, but none can fully replace another.
For example, a market can have substantial outstanding positions while displaying relatively thin order-book liquidity.
Conversely, a market may generate considerable volume through frequent trading without accumulating much open interest.
Reading Price and Open Interest
One of the most common approaches to OI analysis is comparing changes in outstanding contracts with changes in the underlying asset’s price.
This creates four broad market scenarios.
| Price movement | OI movement | Possible interpretation |
|---|---|---|
| Rising | Rising | Expanding outstanding exposure during an uptrend |
| Rising | Falling | Position unwinding or short covering may be contributing |
| Falling | Rising | Expanding outstanding exposure during a downtrend |
| Falling | Falling | Position reductions or liquidations may be contributing |
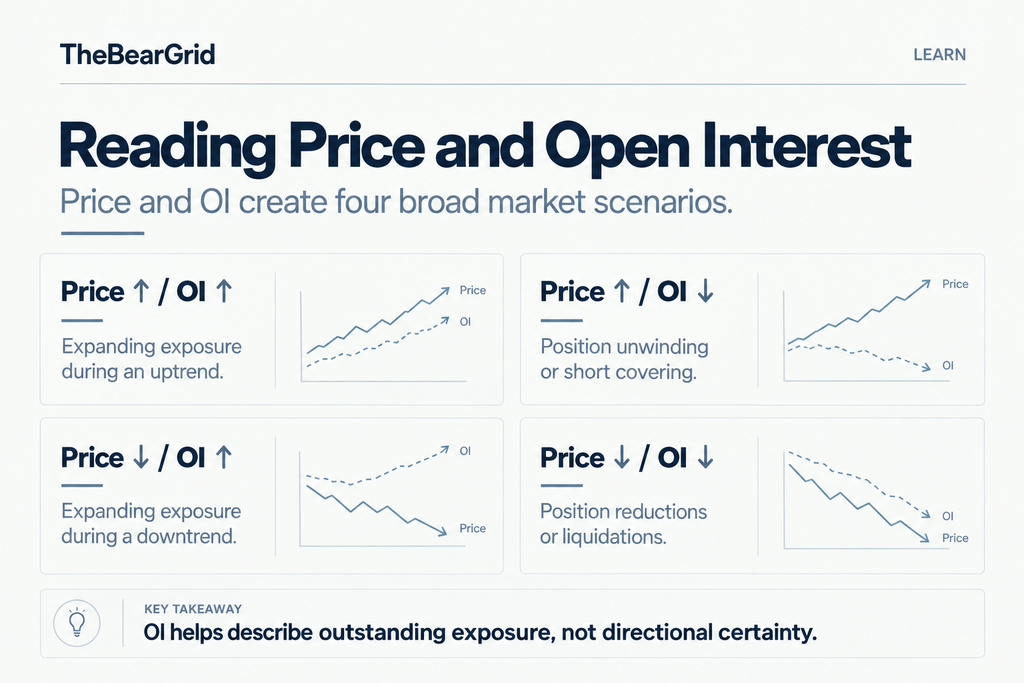
These are analytical starting points—not confirmed explanations of trading behavior.
1. Price ↑ + Open Interest ↑
Suppose Bitcoin rises 5% while BTC perpetual futures OI also increases.
This suggests that outstanding derivatives exposure is expanding during the price advance.
One possible explanation is growing demand for leveraged long positions.
However, every new long position has a corresponding short position.
The increase in OI alone cannot prove that new long traders are responsible for the price movement.
To better understand the market, traders can examine whether funding rates are rising, whether spot buying is supporting the move, and how trading volume is changing.
2. Price ↑ + Open Interest ↓
When Bitcoin rises while OI declines, outstanding contract exposure is contracting.
A possible explanation is short covering.
Traders closing short positions must buy back the contracts required to exit their exposure. Depending on available liquidity and the behavior of counterparties, this buying can contribute to upward price pressure.
However, falling OI does not establish that short covering caused the price increase.
Long-position reductions can also contribute to lower open interest, while buying elsewhere in the market may explain the price rise.
The important observation is that the market is advancing while outstanding derivatives exposure is shrinking.
3. Price ↓ + Open Interest ↑
When prices decline while OI rises, the market is accumulating additional outstanding exposure during a downtrend.
This can occur when traders aggressively seek short exposure.
But it can also involve hedging activity or traders establishing new longs against those shorts.
OI cannot independently distinguish speculative shorts from hedges or other position types.
Funding rates, price premiums, and additional market data are needed to evaluate the nature of that exposure.
4. Price ↓ + Open Interest ↓
A decline in both price and OI suggests that outstanding contract exposure is contracting as the market moves lower.
Possible explanations include traders voluntarily reducing positions or leveraged positions being liquidated.
During a sharp selloff, a rapid reduction in OI can be consistent with substantial position closures.
However, forced liquidation is not the only cause of declining OI, and some liquidated positions may be absorbed by traders opening new exposure.
Consequently, OI changes cannot be used as a direct measurement of liquidation volume.
Why OI Cannot Identify Bullish or Bearish Positioning on Its Own
A common misunderstanding is that increasing OI means more long positions are entering the market than short positions.
That is not how futures contracts work.
Each contract must have opposing long and short exposure.
If a trader establishes a new 100 BTC long position while another participant establishes a matching 100 BTC short position, outstanding exposure increases on both sides simultaneously.
OI increases, but it does not indicate which trader has stronger conviction, which initiated the trade, or which side is more likely to earn a profit.
The distinction becomes particularly important when evaluating institutional hedging activity.
A participant may hold substantial long exposure in the Bitcoin spot market while maintaining a short perpetual futures position to reduce overall directional risk.
That short futures position does not necessarily express a bearish view on Bitcoin.
Similarly, arbitrage strategies can create substantial open interest without the same directional motivation as a speculative trade.
Rising OI indicates expanding outstanding exposure—not automatically expanding bullish speculation.
Open Interest and Funding Rates
Open interest becomes more informative when analyzed alongside funding rates.
The two indicators answer different questions.
Open interest shows the amount of outstanding contract exposure.
Funding rates describe the periodic payment mechanism associated with holding perpetual futures positions.
When funding is positive, long positions generally pay short positions. When funding is negative, short positions generally pay long positions.
For a detailed explanation of this mechanism, see Crypto Funding Rate Explained: How It Works.
Example: Bitcoin Rising With Increasing OI and Funding
Consider a hypothetical market environment:
| Indicator | Earlier | Later |
|---|---|---|
| BTC price | $60,000 | $63,000 |
| BTC open interest | 100,000 BTC | 112,000 BTC |
| Funding rate per settlement | +0.01% | +0.03% |
Illustrative figures, not live market data. Funding rates are assumed to use the same settlement interval.
In this scenario:
Bitcoin has appreciated by 5%.
BTC-denominated OI has increased by 12%, indicating expanding outstanding exposure.
The positive funding rate has also increased, making long positions more expensive to maintain relative to short positions.
Taken together, these observations are consistent with stronger demand for long exposure and increased derivatives participation.
However, they do not prove that the price move is unsustainable or that a liquidation event is imminent.
Spot demand, hedging flows, available liquidity, and the broader market environment may still support the trend.
The relevant question is whether the derivatives market is becoming increasingly dependent on expensive leveraged exposure.
That is a more useful analytical question than treating high OI as an automatic sell signal.
Does Rising OI Mean More Leverage?
Not necessarily.
An increase in OI means that outstanding derivatives contracts have expanded.
It does not directly reveal the average leverage used by the traders holding those contracts.
Consider two traders establishing positions with a notional value of $100,000.
Trader A uses 2× leverage and commits approximately $50,000 in initial margin.
Trader B uses 10× leverage and commits approximately $10,000 in initial margin.
Assuming identical contract specifications, both positions contribute the same notional exposure to OI.
Yet their margin commitments and risk profiles differ materially.
Therefore, even when open interest rises substantially, we cannot determine the leverage distribution of all market participants from OI alone.
Why This Matters in Practice
Suppose two perpetual futures markets each have $1 billion in outstanding notional exposure.
In Market A, traders generally maintain positions with relatively low leverage and substantial margin buffers.
In Market B, many traders operate with significantly higher leverage and smaller margin buffers.
Both markets may report identical open interest.
However, Market B could be more vulnerable to forced position closures during sharp price movements, depending on its margin arrangements and available liquidity.
This is why a high OI figure cannot be interpreted as direct evidence of excessive leverage.
It identifies outstanding exposure, while the associated risk depends on how that exposure is financed and managed.
Open interest measures position size at the market level, not the leverage supporting individual positions.
Why OI Data Can Be Misleading
Even when open interest is measured correctly, its interpretation depends on the reporting unit and calculation methodology.
Crypto derivatives platforms may display OI using different conventions, including:
- Number of contracts.
- Base-asset quantities, such as BTC.
- US dollar-equivalent notional value.
These measurements are related but are not always interchangeable.
USD-Denominated OI Can Rise Without New Contracts
Suppose a BTC perpetual market has outstanding exposure equal to 100 BTC.
Initially, Bitcoin trades at $60,000.
The USD-equivalent open interest is:
100 BTC × $60,000 = $6,000,000
Now suppose Bitcoin rises to $66,000 while outstanding BTC exposure remains unchanged.
The updated USD-equivalent OI becomes:
100 BTC × $66,000 = $6,600,000
The reported dollar value has increased by 10%.
But there has been no increase in BTC-denominated outstanding exposure.
This means a rising USD OI chart can partly reflect price appreciation rather than the creation of additional contracts.
The exact relationship depends on contract specifications and the data provider’s conversion methodology.
This is especially important when comparing different exchanges or evaluating whether derivatives positioning is expanding faster than the underlying market price.
Why OI Data Differs Between Exchanges
Different trading platforms may report different open interest values for the same underlying asset.
Some variation reflects genuine differences in trading activity.
Other differences arise from measurement conventions.
For example, one dataset may include only perpetual futures, while another includes both perpetual and dated futures contracts.
Some platforms report OI in base-asset units, while others emphasize USD-equivalent values.
Counting methods can also affect reported figures.
A meaningful comparison must therefore use consistent contract coverage, reporting units, and observation times.
A Real Example: Bybit’s June 2026 OI Methodology Change
On June 11, 2026, Bybit introduced a change to its displayed open interest methodology from double-sided to single-sided counting.
Previously, its double-sided approach counted the long and short sides of outstanding positions separately.
Under the updated methodology, each outstanding position pair is counted once.
Bybit explained that the reported OI could decline by approximately 50% as a result of this adjustment.
For example, consider a market with:
- 1,000 BTC in long positions.
- 1,000 BTC in matching short positions.
Under the previous double-sided method:
Reported OI = 2,000 BTC
Under single-sided counting:
Reported OI = 1,000 BTC
The displayed figure is 50% lower, but the underlying outstanding positions have not suddenly disappeared.
The reporting method has changed.
Bybit also stated that the methodology update would not affect traders’ existing positions, margin requirements, or profit and loss calculations.
This example illustrates an important principle:
A sharp change in a derivatives metric does not always represent a corresponding change in market behavior.
Analysts comparing historical OI data across this methodology change need to account for the reporting adjustment before interpreting the trend.
Source: Bybit — Update to the Open Interest (OI) Calculation Method, May 28, 2026.
Final Takeaway
Open interest is a useful measure of outstanding activity in crypto derivatives markets.
But its value lies in understanding what it measures—and what it cannot tell us.
Rising OI shows expanding outstanding contract exposure. Falling OI indicates that exposure is contracting.
Neither observation independently reveals whether the market is bullish, bearish, overleveraged, or approaching a reversal.
For a more complete interpretation, OI should be analyzed alongside price movements, trading volume, funding rates, and liquidity conditions.
The unit and methodology behind the data also matter. A change in USD-denominated OI or an exchange’s reporting convention can create movements that do not reflect the creation or closure of underlying contracts.
The key question is not simply whether open interest is rising or falling, but what the change reveals about outstanding exposure within the broader market structure.
For traders and analysts, that distinction turns OI from a standalone number into a more useful tool for understanding crypto derivatives markets.
Related Research
- What Are Perpetual Futures? — Understanding the contracts, leverage, and market mechanisms behind perpetual futures.
- Crypto Funding Rate Explained: How It Works — How funding payments work and what they reveal about the cost of leveraged positioning.
- How Crypto Exchanges Compete for Perpetual Futures Traders — Examining the role of liquidity, trading costs, and market infrastructure in exchange competition.
References
- CME Group — Open Interest. Educational explanation of futures open interest and its relationship with trading volume.
- CME Group — Volume and Open Interest Definitions. Official explanation of contract volume and single-sided open interest counting.
- Bybit — Update to the Open Interest (OI) Calculation Method. Official announcement dated May 28, 2026.
- CoinGlass — Coins Markets API Documentation. Data-field definitions for USD-denominated OI, quantity-based OI, funding rates, and other derivatives indicators.
Source review date: October 26, 2026. Numerical examples are hypothetical unless explicitly identified as a historical exchange announcement. Open interest definitions, units, and reporting conventions may vary across venues and data providers.
Disclaimer: This article is for educational and informational purposes only and does not constitute financial or investment advice. Cryptocurrency derivatives involve substantial risk, including liquidation and the potential loss of posted margin.