A trader opens a leveraged Bitcoin futures position. The market moves against the trade, but the price shown on the candlestick chart has not yet reached the estimated liquidation price.
Suddenly, the position is liquidated.
How can this happen?
The answer lies in how crypto exchanges calculate margin requirements, monitor positions, and execute forced liquidations.
Liquidation is not simply a consequence of using high leverage. It is a risk-management process designed to close or reduce positions when the collateral supporting them becomes insufficient.
Understanding this process requires looking beyond leverage ratios and liquidation prices.
Traders also need to understand mark prices, maintenance margin, margin modes, and the exchange’s liquidation engine.
Table of Contents
What Triggers a Crypto Futures Liquidation?
Liquidation occurs when a derivatives position or margin account no longer satisfies the exchange’s required collateral conditions.
When traders open leveraged futures positions, they commit margin rather than paying the full notional value of the position.
For example, a trader using 10× leverage may control a $10,000 position with approximately $1,000 of initial margin.
However, the margin supporting the position changes as the market moves.
A losing position reduces available equity. If that equity falls to the level required by the exchange’s maintenance margin rules, the position may be subject to liquidation.
Initial Margin vs. Maintenance Margin
Two concepts are particularly important.
Initial Margin
The collateral required to establish a leveraged position.
For a simplified linear futures position:
Initial Margin = Position Notional Value ÷ Leverage
Maintenance Margin
The minimum collateral requirement for maintaining an existing position.
Maintenance margin requirements generally depend on contract specifications, exposure size, and applicable risk tiers.
Larger positions may face higher maintenance margin rates.
| Margin type | Purpose |
|---|---|
| Initial Margin | Required to open a position |
| Maintenance Margin | Required to keep a position open |
| Additional Margin | Extra collateral that may reduce liquidation risk |
For a simplified isolated-margin position, the relevant relationship is:
Position Equity = Initial Margin + Unrealized P&L − Applicable Charges
A liquidation condition can be expressed conceptually as:
Position Equity ≤ Maintenance Margin Requirement
This is a simplified representation. Exchanges may include closing fees, risk-tier adjustments, and other account-specific calculations.
In cross-margin or portfolio-margin systems, liquidation may instead be determined by an account-level maintenance margin ratio.
The fundamental principle remains the same: when the collateral supporting exposure becomes insufficient, the exchange’s risk engine intervenes.
For more information on leveraged contract mechanics, see What Are Perpetual Futures?.
Mark Price vs. Last Traded Price
One of the most important distinctions in crypto futures trading is the difference between the mark price and the last traded price.
These two prices can differ, particularly during periods of volatility.
Last Traded Price
The last traded price is the price at which the most recent transaction occurred on an exchange.
It is commonly displayed on the default trading chart.
However, individual transactions can temporarily push this price away from the broader market.
For example, a large market sell order may cause the last traded price to fall sharply on an exchange with relatively limited order-book liquidity.
Mark Price
The mark price is a reference price calculated by the exchange to evaluate the value and risk of derivatives positions.
For conventional crypto perpetual futures, the calculation commonly incorporates underlying spot-market information and adjustments associated with the futures market.
The exact methodology differs between exchanges.
Binance and Bybit both use mark-price mechanisms for liquidation-related calculations.
This approach aims to reduce unnecessary liquidations caused by isolated price spikes or market manipulation.
However, it does not eliminate liquidation risk during genuine market-wide price movements.
Why Can Liquidation Occur Before the Chart Reaches the Liquidation Price?
Consider a hypothetical BTC perpetual position with the following values:
| Indicator | Price |
|---|---|
| Entry price | $60,000 |
| Estimated liquidation price | $54,500 |
| Last traded price | $54,800 |
| Mark price | $54,450 |
Assume the position uses isolated margin and the exchange triggers liquidation based on the mark price.
Although the last traded price remains above $54,500, the mark price has already fallen below the liquidation threshold.
The exchange may therefore trigger liquidation.
A trader watching only the default candlestick chart might not see the price movement responsible for the liquidation.
This is why understanding the mark price is essential.
The price used to trigger liquidation may differ from the price displayed on the default trading chart.
The estimated liquidation price can also change as margin balances, fees, and contract requirements change.
In cross-margin and portfolio-margin systems, the account-level risk calculation may be more important than any single displayed liquidation price.
How Leverage Changes Liquidation Risk
Higher leverage allows traders to control larger positions with less initial capital.
However, it also reduces the margin buffer available to absorb adverse price movements.
Two different situations should be distinguished.
First, increasing leverage while keeping the initial margin unchanged allows a trader to establish a larger position.
Second, increasing leverage while keeping the position’s notional value unchanged reduces the initial margin required to support that position.
Both can increase liquidation risk, but through different mechanisms.
Example: BTC Long Position at Different Leverage Levels
Consider a hypothetical trader opening a long position of 1 BTC at $60,000.
The position’s initial notional value is $60,000.
Assume a simple USDT-margined isolated position with:
- No additional margin or other collateral.
- A maintenance margin requirement equal to 0.5% of the position’s current marked notional value.
- No closing fees, funding deductions, or risk-tier changes.
For this illustration:
Unrealized P&L = Mark Price − $60,000
Maintenance Margin = Mark Price × 0.5%
Liquidation is assumed to occur when position equity reaches the maintenance margin requirement.
The resulting values are:
| Leverage | Initial Margin | Approx. Liquidation Price | Adverse Price Move |
|---|---|---|---|
| 5× | $12,000 | $48,241 | -19.6% |
| 10× | $6,000 | $54,271 | -9.5% |
| 20× | $3,000 | $57,286 | -4.5% |
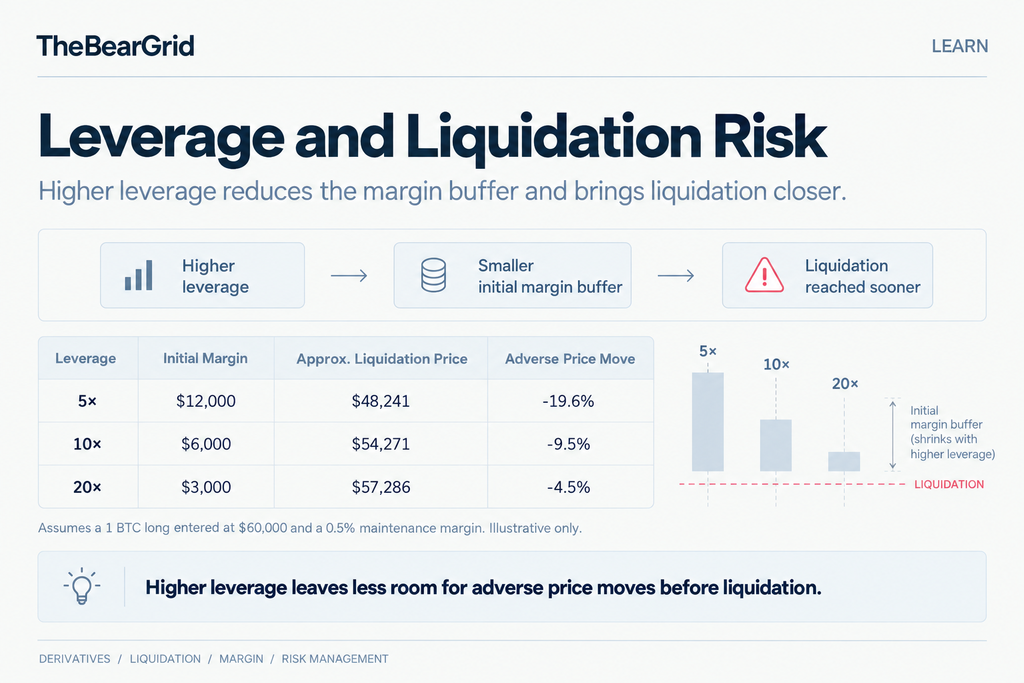
Illustrative calculations only. Actual exchange liquidation prices depend on contract rules, fees, funding payments, margin mode, and risk tiers.
In each case, the trader holds the same 1 BTC exposure.
The difference is the amount of collateral supporting that exposure.
At 5× leverage, the position has a larger margin buffer.
At 20× leverage, a considerably smaller adverse price movement can cause the position to reach its maintenance margin requirement.
This is why even relatively modest price movements can liquidate highly leveraged positions.
Why Position Size Also Matters
Now consider a trader with $1,000 in available margin.
At 5× leverage, the trader can establish approximately $5,000 in notional exposure.
At 20× leverage, the same margin can support approximately $20,000 in exposure.
A 1% adverse movement produces an unrealized loss of approximately:
- $50 on the $5,000 position.
- $200 on the $20,000 position.
The higher-leverage position loses four times as much money for the same percentage price movement.
This relationship is especially important for actual trading decisions.
Leverage does not change the percentage movement of the underlying asset. It changes the exposure and collateral relationship through which that movement affects a trader’s equity.
Funding Payments Can Also Affect Liquidation Risk
Funding costs introduce another important variable.
In perpetual futures, traders may periodically pay or receive funding depending on the funding rate and their position direction.
If funding payments are deducted from the margin supporting a position, the remaining collateral decreases.
The liquidation threshold may then move closer to the current mark price.
For example, a trader holding a long position during a period of persistently positive funding may accumulate funding expenses.
If these expenses reduce position margin, liquidation risk can increase even without a corresponding change in the entry price.
The precise treatment depends on the exchange’s margin rules and the balance available to pay funding.
For the complete payment mechanism, see Crypto Funding Rate Explained: How It Works.
Isolated vs. Cross Margin
The choice of margin mode influences how collateral supports derivatives positions and how liquidation risk spreads across an account.
Two commonly used modes are isolated margin and cross margin.
Isolated Margin
In isolated margin mode, collateral is assigned to an individual position.
The position’s liquidation condition is evaluated using the margin allocated to that position.
For example, a trader might allocate $1,000 to an isolated BTC perpetual position while maintaining additional funds elsewhere in the trading account.
If the position is liquidated, the direct loss is generally limited to its allocated position margin under the applicable contract rules.
Other account funds are not automatically used to support the position unless a feature such as automatic margin replenishment is enabled or additional margin is transferred.
This distinction is important because some exchanges support automatic margin additions even when a position is labeled isolated.
Isolated margin therefore provides more explicit control over which collateral supports a position, but it does not remove the risk of losing that allocated collateral.
Cross Margin
In cross-margin mode, eligible collateral can be shared across multiple positions.
This may provide a larger combined margin buffer.
However, losses in one position can reduce the collateral available to support other positions.
Consider a simplified account holding two positions:
| Position | Unrealized P&L |
|---|---|
| BTC long | -$2,000 |
| ETH long | +$500 |
| Combined unrealized P&L | -$1,500 |
Under cross margin, the combined account exposure and eligible collateral influence the account’s ability to maintain its positions.
The losing BTC position can weaken the overall account’s margin condition even if the ETH position is profitable.
If account risk becomes severe enough, multiple positions may be affected by liquidation or forced reduction procedures.
This is why cross margin should not be interpreted as automatically safer than isolated margin.
It provides additional collateral flexibility but can also connect risks that would otherwise be managed separately.
How the Two Modes Compare
| Feature | Isolated Margin | Cross Margin |
|---|---|---|
| Collateral allocation | Position-specific | Shared eligible collateral |
| Liquidation assessment | Primarily position-level | Primarily account-level |
| Exposure to other positions’ losses | Generally separated | Connected through shared collateral |
| Automatic margin support | Depends on settings | Shared collateral is fundamental |
| Risk management focus | Individual position | Overall account |
Some exchanges also offer portfolio margin, which uses more complex risk calculations and may account for offsets between eligible positions.
The exact rules depend on the venue, product, and account configuration.
What Happens When Liquidation Begins?
A common assumption is that the exchange immediately closes the entire position once the liquidation threshold is reached.
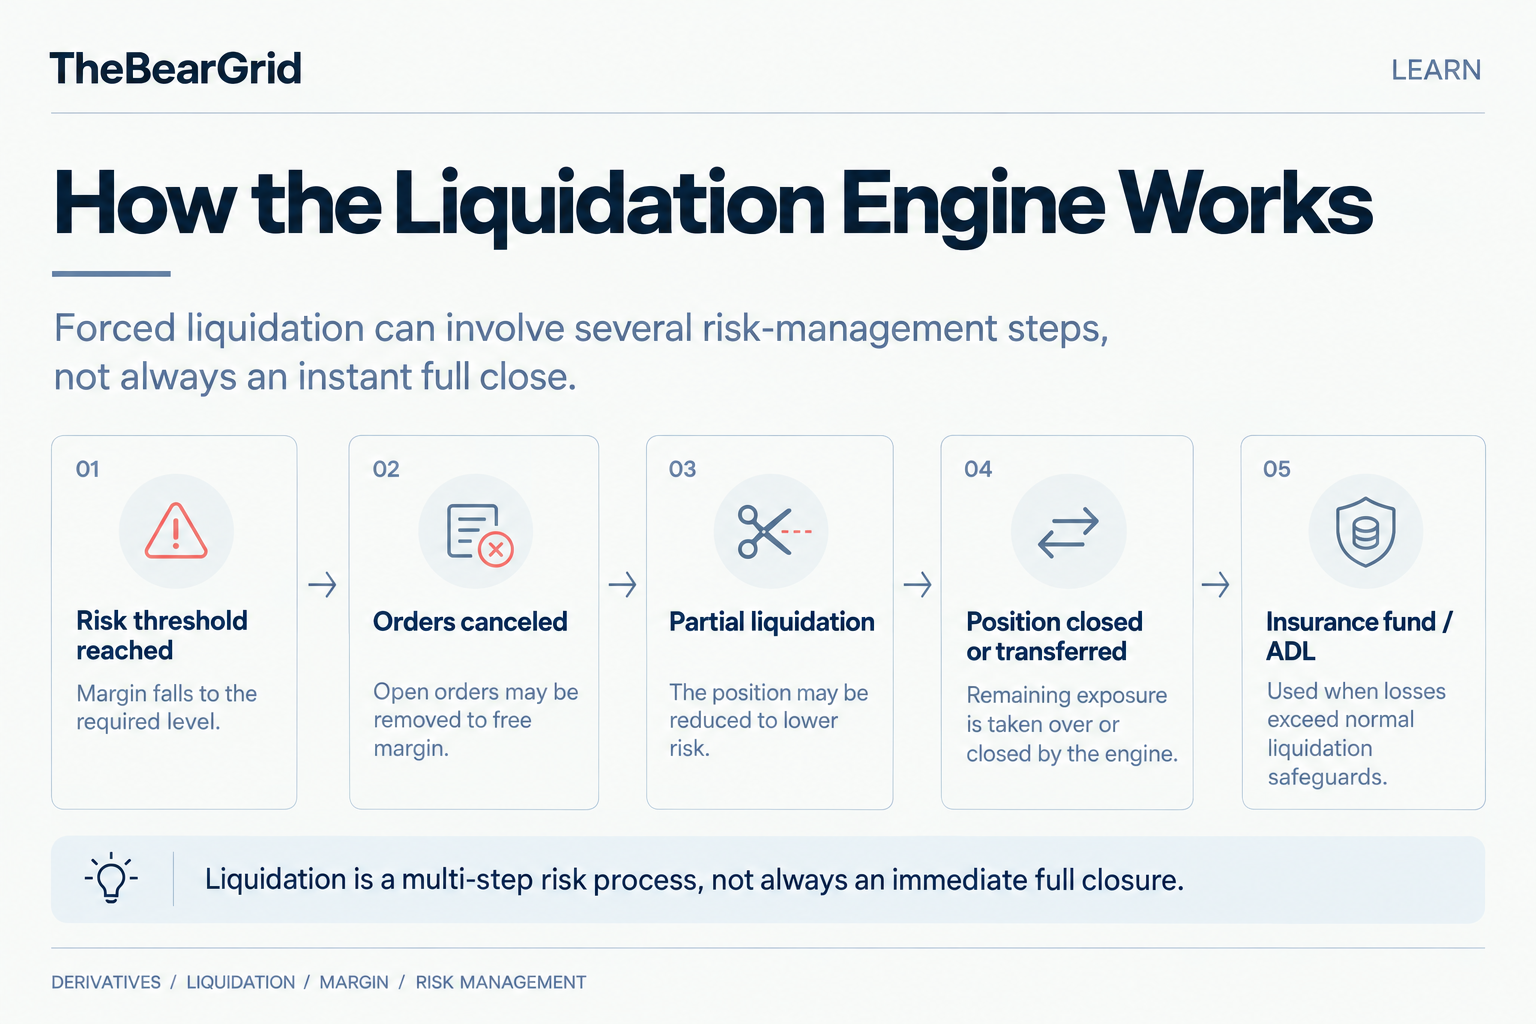
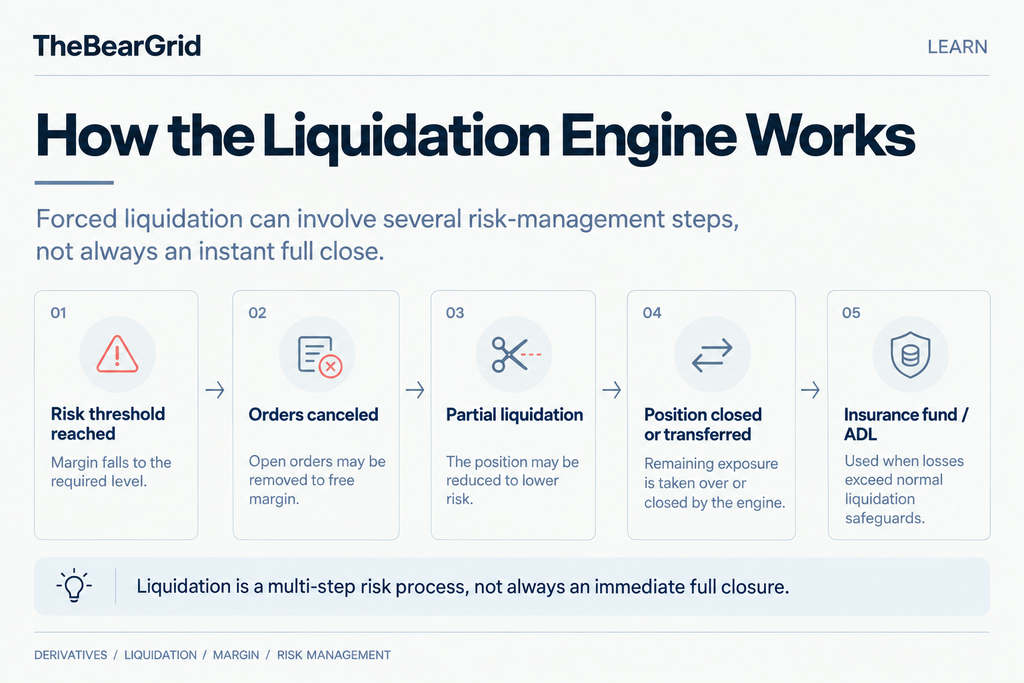
In practice, liquidation engines may follow multiple steps.
These procedures are designed to reduce risk while attempting to avoid unnecessary full liquidation.
The sequence differs by exchange and margin mode.
Step 1: Risk Threshold Is Reached
The exchange continuously monitors the risk of outstanding positions or accounts.
When the relevant margin threshold is breached, the liquidation process begins.
For certain isolated-margin positions, this occurs when the mark price reaches the liquidation price.
For cross-margin and portfolio-margin accounts, an account-level maintenance margin ratio may trigger the process.
Step 2: Orders May Be Canceled
Some exchanges begin by canceling active orders that consume margin or would increase risk.
Canceling these orders can release reserved collateral.
If this restores the required margin condition, further liquidation may be avoided.
This does not guarantee that the position will survive.
Step 3: Partial Liquidation May Occur
For larger positions, exchanges may attempt partial liquidation.
Instead of immediately closing all outstanding exposure, the liquidation engine reduces part of the position.
This may move the remaining position into a lower risk tier, reducing its maintenance margin requirement.
For example, a trader holding a $500,000 perpetual futures position may face a higher margin requirement than a trader holding a $50,000 position in the same contract.
A partial reduction may allow the remaining exposure to satisfy a lower risk-tier requirement.
However, partial liquidation is not universally available, and the exchange may proceed directly to a full close depending on the position and applicable rules.
Step 4: Remaining Exposure May Be Taken Over or Closed
If earlier measures cannot restore a sufficient margin buffer, the remaining position may be fully liquidated.
The exchange’s liquidation engine attempts to manage the resulting exposure according to its execution and clearing procedures.
For some venues, the trader’s liquidated position is transferred to the liquidation engine at a defined bankruptcy price.
The engine then attempts to close or otherwise resolve the position in the market.
The actual execution price and the trader’s liquidation trigger price are not necessarily the same.
This distinction becomes particularly important during rapid price movements and periods of limited liquidity.
Bankruptcy Price, Insurance Funds, and ADL
Liquidation involves more than closing an individual trader’s position.
Exchanges must also manage the possibility that a liquidated position cannot be closed before its collateral is exhausted.
This is where bankruptcy prices, insurance funds, and auto-deleveraging mechanisms become relevant.
Liquidation Price vs. Bankruptcy Price
The liquidation price is the threshold at which the exchange’s risk system initiates liquidation under the applicable rules.
The bankruptcy price generally represents the level at which the collateral supporting a position would be exhausted under the exchange’s calculation methodology.
These prices serve different purposes.
For a simplified losing long position, the liquidation threshold is generally reached before the bankruptcy threshold.
The maintenance margin requirement creates a buffer intended to give the exchange an opportunity to manage the position before losses exceed available collateral.
However, fast market movements and insufficient liquidity can make orderly execution difficult.
What Is an Insurance Fund?
An insurance fund is a financial reserve used by a derivatives exchange to help absorb losses arising from liquidated positions that cannot be closed within their available collateral.
For example, consider a hypothetical position taken over by a liquidation engine.
Its bankruptcy price is $50,000.
If the exchange can close the position at a more favorable price, the resulting surplus may be retained by the insurance fund according to the venue’s rules.
If the position can only be closed at a worse price and the loss exceeds the collateral allocated to it, the insurance fund may absorb the shortfall.
The fund is not a guarantee that a liquidated trader will recover their lost margin.
Its primary role is to manage losses within the derivatives clearing system and reduce the need for extraordinary risk measures.
What Is Auto-Deleveraging (ADL)?
Auto-deleveraging is a mechanism that may be activated when liquidation-related losses cannot be adequately covered through the exchange’s normal liquidation process and available financial safeguards.
Under an ADL system, the exchange may automatically reduce or close selected profitable positions on the opposite side of the market.
Selection rules typically consider characteristics such as profitability and leverage, although the exact methodology varies.
This can affect traders whose positions are profitable and who have not themselves breached their maintenance margin requirements.
For example, during an extreme market decline, a large number of leveraged long positions may be liquidated.
If the resulting losses exceed the exchange’s available protections, selected short positions may be automatically reduced under the venue’s ADL rules.
This shows why liquidation risk is not limited to the trader whose collateral becomes insufficient.
In extreme market conditions, the exchange’s risk-management architecture can influence other market participants as well.
Why Exchange Liquidation Design Matters
Binance, Bybit, and OKX publish rules covering different elements of their liquidation systems.
Their documentation describes mechanisms involving mark-price monitoring, maintenance margin calculations, position reductions, insurance arrangements, or related risk controls.
However, these systems are not identical.
Differences in margin calculations, liquidation execution, insurance fund structures, and ADL procedures can affect how an exchange manages stressed derivatives positions.
For traders comparing exchanges, these mechanisms are part of the platform’s broader risk infrastructure.
Execution fees and available leverage are only part of the picture.
The procedures used when positions become distressed also matter.
Reading Liquidation Data With Open Interest
Liquidation data can provide information about periods of stress in crypto derivatives markets.
During sharp price movements, data platforms often report the estimated notional value of liquidated long and short positions.
Large liquidation totals may coincide with increased volatility and rapid position adjustments.
However, liquidation figures should not be interpreted as direct measurements of total capital lost.
Liquidation Notional Is Not the Same as Trader Losses
Suppose a market data provider reports $100 million in liquidated long positions.
This generally refers to the notional value of positions liquidated under the provider’s reporting methodology.
It does not necessarily mean traders lost $100 million in posted collateral.
Consider a simplified $100,000 position established using $10,000 of initial margin.
The position’s notional value is $100,000, but the capital committed to support it is considerably smaller.
If the entire position is liquidated, the reported liquidation notional may reflect the full position value.
The trader’s realized loss, fees, and remaining collateral depend on the execution and accounting rules.
This distinction matters when evaluating headlines about large crypto liquidation events.
What Happens to Open Interest During Liquidations?
A liquidation may reduce open interest, but it does not always do so.
Open interest measures outstanding contracts.
Whether OI declines depends on how liquidated exposure is transferred, matched, or closed.
If an existing long and short position are both closed, open interest decreases.
If a liquidated position is transferred to a new participant while the opposing contract remains outstanding, total OI may remain unchanged.
Therefore, the amount of reported liquidations and the change in open interest are not directly interchangeable.
For a more detailed explanation, see Crypto Open Interest Explained: How to Read OI.
Liquidation Cascades and Market Liquidity
Liquidation activity can contribute to self-reinforcing price movements.
Consider a sharp decline in Bitcoin prices.
Leveraged long positions begin reaching their liquidation thresholds.
The liquidation engine may need to sell or transfer long exposure into a declining market.
If substantial selling occurs while available buying liquidity is limited, prices can fall further.
Additional long positions may then reach their own liquidation thresholds.
This sequence can contribute to a liquidation cascade.
A similar process can occur in the opposite direction when rising prices force short positions to close through buying activity.
However, a large liquidation total does not prove that liquidations were the initial cause of the market move.
Macroeconomic announcements, spot selling, hedging flows, or other market events may have triggered the initial price movement.
Liquidations can then amplify an existing move rather than initiate it.
This is why liquidation data is most useful when evaluated alongside price, open interest, trading volume, funding rates, and market liquidity.
Final Takeaway
Crypto futures liquidation is a risk-management mechanism, not simply a fixed percentage loss determined by leverage.
A position becomes vulnerable when its available collateral can no longer satisfy the exchange’s maintenance margin requirements.
Leverage influences the amount of collateral supporting exposure, while mark prices and margin calculations determine when liquidation conditions are reached.
The process does not necessarily end with an immediate full position closure. Depending on the venue and account configuration, liquidation systems may cancel orders, reduce positions, transfer exposure, or use additional financial safeguards.
For traders, understanding these mechanisms is essential to evaluating the real risks of leveraged futures positions.
For market analysts, liquidation data can reveal periods of derivatives stress, but it must be interpreted carefully alongside open interest and available liquidity.
The central distinction is between the risk carried by an individual position and the mechanisms an exchange uses to manage that risk across the broader market.
Understanding both provides a more complete picture of how crypto derivatives markets function.
Related Research
- What Are Perpetual Futures? — An introduction to perpetual futures contracts, leverage, and their trading mechanics.
- Crypto Funding Rate Explained: How It Works — Understanding funding payments and their impact on maintaining leveraged positions.
- Crypto Open Interest Explained: How to Read OI — How outstanding derivatives exposure changes and what OI reveals about market activity.
- How Crypto Exchanges Compete for Perpetual Futures Traders — How trading costs, liquidity, and infrastructure shape exchange competition.
References
- Binance — Binance Futures Liquidation Protocols. Official explanation of mark prices, maintenance margin, liquidation procedures, and insurance mechanisms. Updated January 4, 2026.
- Bybit — Mark Price (Perpetual and Expiry Contracts). Official explanation of mark-price calculations and liquidation triggers. Updated September 4, 2026.
- Bybit — Trading Rules: Liquidation Process (Unified Trading Account). Official explanation of margin modes, partial liquidation, and position risk calculations. Updated August 7, 2026.
- Bybit — Insurance Fund. Official explanation of bankruptcy prices, insurance fund balances, and excess liquidation losses. Updated March 24, 2026.
- OKX — How Does Liquidation Work in Futures Trading?. Official documentation covering maintenance margin and forced position reductions. Updated August 5, 2026.
Source review date: October 27, 2026. All numerical examples are hypothetical and do not represent current Bitcoin prices, exchange margin requirements, or executable liquidation prices. Exchange-specific rules may change, and product availability can vary by jurisdiction.
Disclaimer: This article is intended for educational and informational purposes only and does not constitute investment advice. Crypto derivatives carry significant risk, including the potential loss of posted collateral and additional exposure under certain margin arrangements.