Open interest is one of the most widely followed indicators in crypto derivatives markets. Yet comparing it across exchanges is not as straightforward as checking which platform reports the largest number.
Contract coverage, reporting units, and even the way open positions are counted can differ between venues.
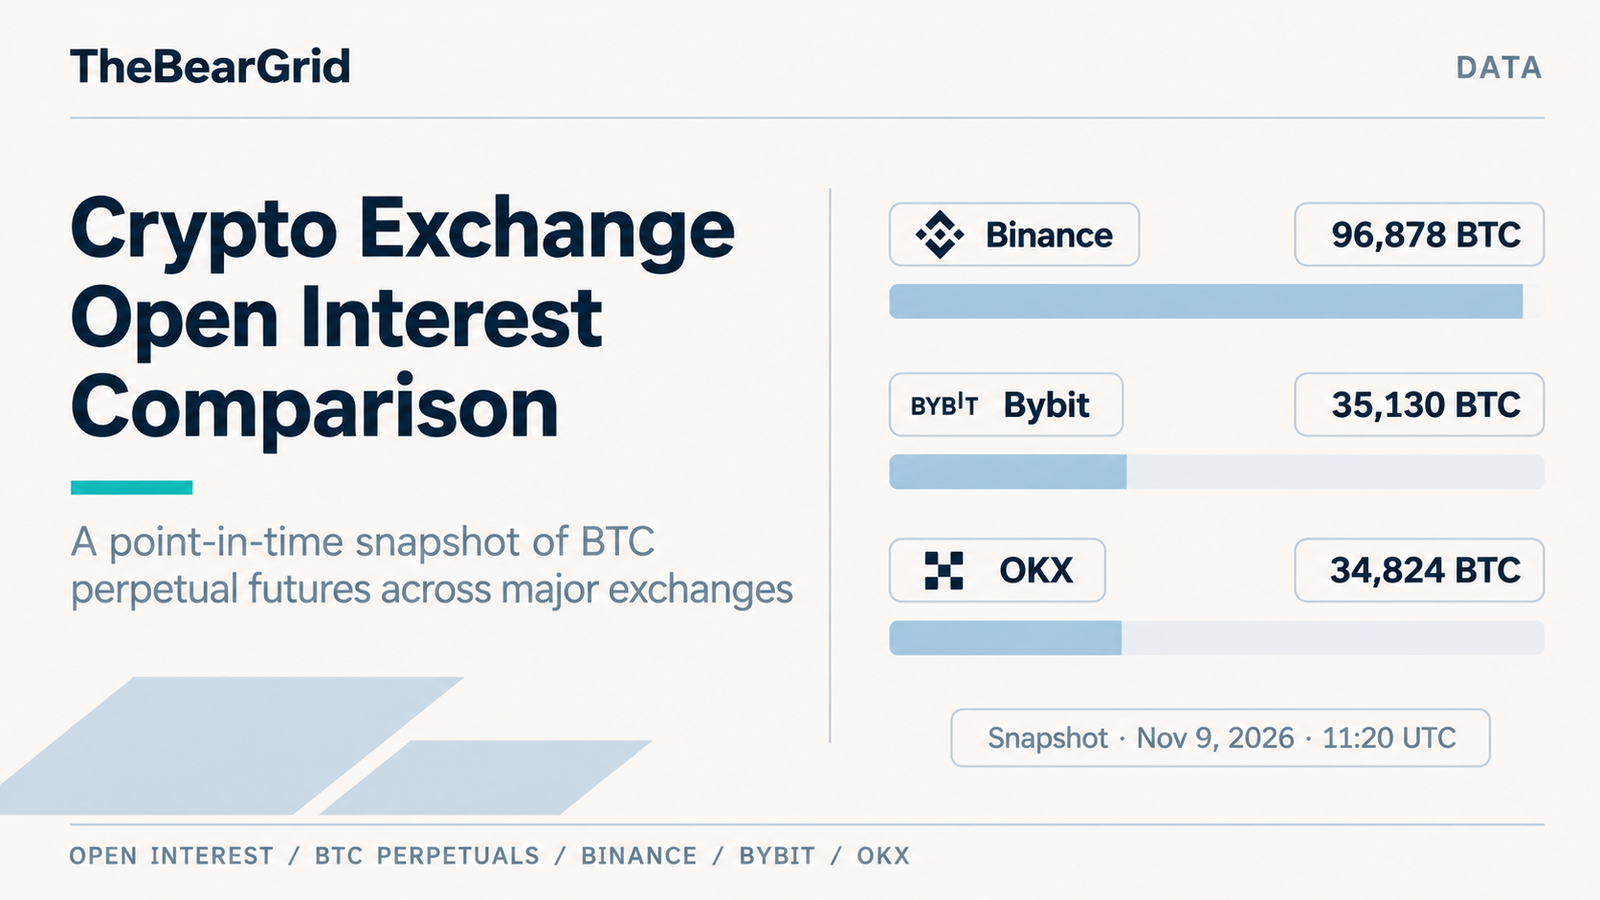
This report examines Bitcoin perpetual futures open interest across Binance, Bybit, and OKX using a snapshot from November 9, 2026, at 11:20 UTC.
Rather than attempting to rank every derivatives exchange, the analysis focuses on comparable BTC/USDT perpetual contracts and what their outstanding positions reveal about the distribution of trading exposure.
The central question is simple: What can an exchange’s open interest tell us—and what does it leave unanswered?
Table of Contents
1. Scope and Methodology
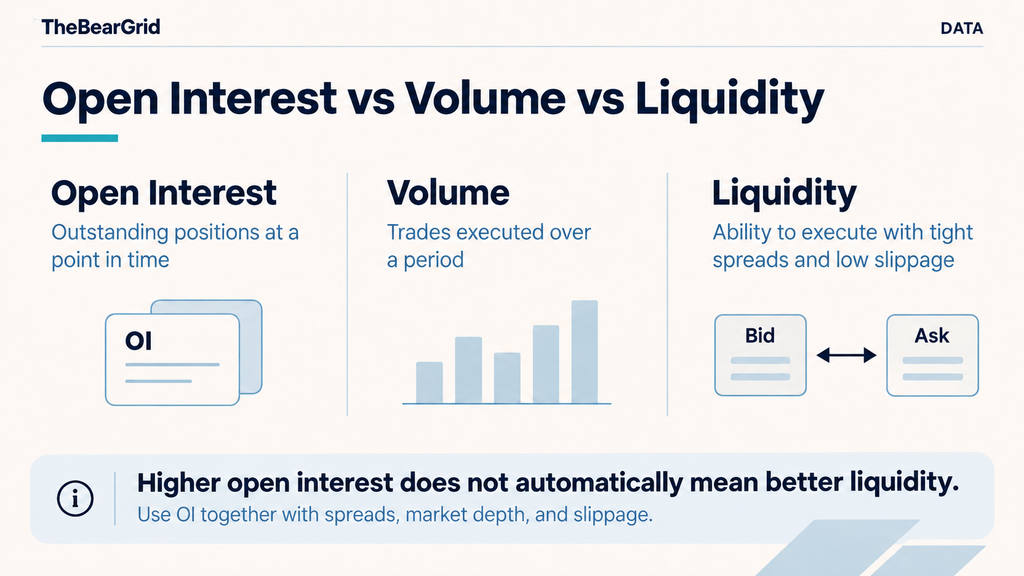
Open interest (OI) measures outstanding derivatives contracts that have not been closed or settled.
Unlike trading volume, which measures transactions during a period, open interest describes positions remaining open at a particular point in time.
For this comparison, we use three USDT-margined Bitcoin perpetual contracts.
| Exchange | Contract | Product Type |
|---|---|---|
| Binance | BTCUSDT | USDT-margined perpetual |
| Bybit | BTCUSDT | USDT-margined perpetual |
| OKX | BTC-USDT-SWAP | USDT-margined perpetual |
The reported OI is expressed in BTC, with approximate USD values calculated using each venue’s mark price.
All three figures are taken from the same dated observation published by 21 BTC’s derivatives dashboard, which aggregates data from the exchanges’ public APIs.
Measurement rules:
- Observation time: November 9, 2026, 11:20 UTC.
- Instrument coverage: one BTC/USDT perpetual contract per exchange.
- OI basis: single-sided outstanding contract exposure.
- USD conversion: BTC-denominated OI multiplied by the corresponding mark price.
- Market share: each contract’s proportion of this three-contract sample.
The results do not represent total exchange-wide derivatives OI or the global Bitcoin futures market.
They also exclude coin-margined futures, USDC-margined contracts, dated futures, options, and other exchanges.
These boundaries are important. Without consistent contract coverage, a comparison can produce misleading conclusions.
2. BTC Perpetual Open Interest Snapshot
The three selected exchanges collectively held approximately 166,832 BTC in outstanding perpetual futures exposure, equivalent to around $12.47 billion at the observed mark prices.
| Exchange | Open Interest (BTC) | Approx. USD Value | Share of Selected Sample |
|---|---|---|---|
| Binance | 96,878 | $7.24B | 58.07% |
| Bybit | 35,130 | $2.63B | 21.06% |
| OKX | 34,824 | $2.60B | 20.87% |
| Total | 166,832 | $12.47B | 100.00% |
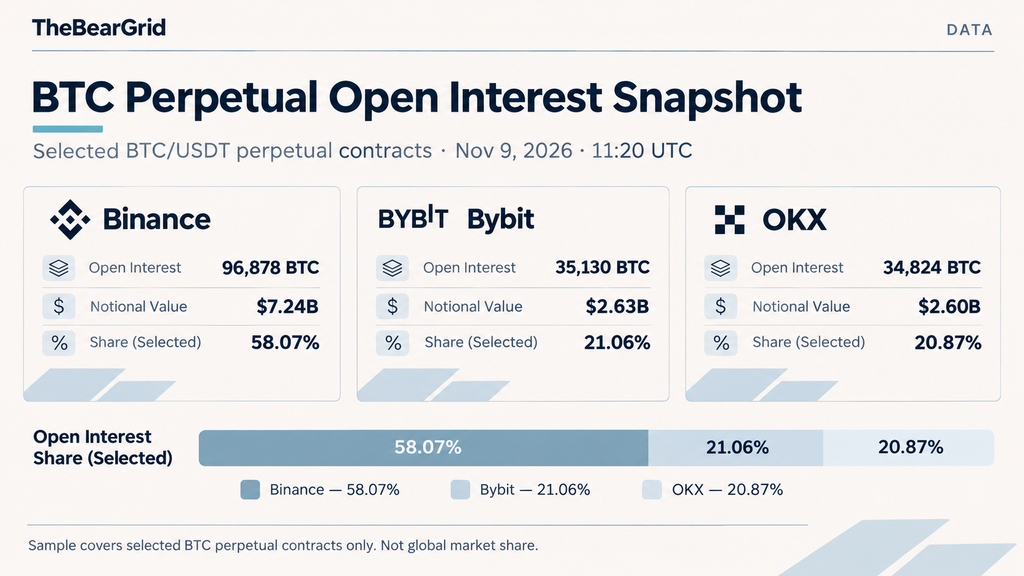
Source: 21 BTC — Bitcoin Derivatives, November 9, 2026, 11:20 UTC. Approximate USD values are rounded. Sample shares are calculated from the BTC-denominated observations.
Binance Holds the Largest Share of the Selected Sample
Binance accounted for approximately 58% of the outstanding BTC positions across the three contracts.
Its reported OI was roughly 2.8 times that of either Bybit or OKX.
This indicates that more BTC perpetual exposure was outstanding on the selected Binance contract at that moment.
However, the result should not be interpreted as Binance holding 58% of global Bitcoin derivatives open interest.
The denominator includes only three contracts, not all exchanges or all BTC futures products.
Bybit and OKX Were Nearly Equal
Bybit reported 35,130 BTC in open interest, compared with 34,824 BTC on OKX.
The difference was just 306 BTC, or approximately 0.18 percentage points of the selected sample.
At this level of proximity, small changes in outstanding positions could alter their relative ranking.
A single snapshot is therefore best treated as a reference point—not evidence that one venue consistently attracts more Bitcoin derivatives exposure than the other.
3. Why Exchange OI Figures Can Be Misleading
An important methodological change took place on Bybit in June 2026.
Previously, the exchange used a bilateral method that counted the long and short sides of outstanding positions separately.
Under this approach, a contract involving 1,000 BTC of long exposure and 1,000 BTC of short exposure could be displayed as 2,000 BTC of open interest.
On June 11, 2026, Bybit moved its displayed OI to a single-sided calculation.
The same example would therefore be reported as 1,000 BTC rather than 2,000 BTC.
Crucially, the adjustment did not mean that half of the actual outstanding positions had disappeared. It represented a change in measurement.
Bybit introduced API fields including singleOpenInterest and singleOpenInterestValue to support the revised methodology.
For this comparison, the Bybit observation uses the single-sided figure.
This distinction matters when comparing exchange data from different providers or examining historical OI charts spanning the methodology change.
A reported OI decline is not always a decline in actual market exposure. Sometimes the calculation itself has changed.
Analysts should verify the counting convention before combining data from multiple exchanges.
For background, see Bybit’s official announcement on the OI methodology update.
4. Does Higher Open Interest Mean Better Liquidity?
An exchange with substantial open interest has attracted or retained significant outstanding derivatives exposure.
That can be an important sign of market participation.
But open interest is not a direct measurement of execution quality.
Consider two exchanges with similar BTC perpetual OI.
One may maintain deep order books and tight bid-ask spreads during normal trading hours. The other could have comparable outstanding positions but relatively thin liquidity available near the current market price.
Their OI figures may look similar even though a large market order could produce very different execution costs.
Open interest also says little about how quickly traders can exit during a market shock.
For practical exchange evaluation, traders should examine OI alongside:
- Order-book depth: available liquidity near the best bid and ask.
- Bid-ask spreads: the immediate cost of crossing the market.
- Slippage: the difference between expected and actual execution.
- Trading volume: the amount of activity executed over a defined period.
These measures are related, but they are not interchangeable.
Higher OI can coexist with poor execution conditions, particularly in stressed markets.
Read more in Why Crypto Exchange Trading Volume Doesn’t Equal Liquidity.
5. What an OI Snapshot Cannot Tell Us
The November 9 snapshot identifies where outstanding positions were concentrated among the selected contracts.
It does not explain the direction of those positions, how much leverage individual traders used, or why the positions were opened.
Open Interest Is Not a Long/Short Forecast
Every outstanding futures contract involves both a long and a short side.
A higher OI figure does not mean that more traders are bullish than bearish.
It also does not demonstrate that prices are about to rise or fall.
To evaluate directional pressure, analysts typically combine OI changes with price behavior, funding rates, and other positioning indicators.
Even then, the relationship remains interpretive rather than predictive.
USD-Denominated OI Can Change Without New Contracts
The distinction between BTC units and USD value is also important.
For example, suppose a perpetual market holds 10,000 BTC in outstanding positions.
At a Bitcoin price of $70,000, that exposure is worth approximately $700 million.
If Bitcoin rises to $77,000 while outstanding BTC contracts remain unchanged, the USD value increases to $770 million.
The reported notional exposure has risen by 10%, even though BTC-denominated OI has not changed.
For historical comparisons, researchers should therefore separate changes in contract quantity from changes in underlying asset prices.
One Observation Is Not a Trend
A single snapshot cannot determine whether an exchange is gaining or losing derivatives market share over time.
That requires repeated observations using consistent instruments, timestamps, and calculation methods.
Comparing OI at different times of day or across changing contract universes can create apparent movements that have little to do with genuine competitive shifts.
A reliable trend analysis should preserve the same measurement rules across each observation.
6. How This Data Fits Into Exchange Research
Open interest offers a different perspective from trading volume.
Volume shows how actively a market has traded over a period. OI shows how much exposure remains outstanding at a specific moment.
Together, they help researchers distinguish between rapid turnover and sustained positioning.
This is particularly relevant when evaluating exchange competition.
An exchange may report high trading volume because traders transact frequently, but a smaller amount of outstanding exposure may remain open.
Another venue could have lower turnover while supporting a substantial base of longer-held derivatives positions.
Neither pattern is inherently better.
The interpretation depends on liquidity, contract design, market conditions, and the strategies being used.
For this reason, OI should be considered one component of exchange analysis rather than a standalone ranking metric.
Our earlier research on why derivatives market share shifts between exchanges examines how trading costs, liquidity, products, and incentives can redirect activity between venues.
Open interest adds another dimension to that assessment: the distribution of positions that remain open after trading has taken place.
Conclusion
The November 9, 2026 snapshot shows Binance holding the largest BTC perpetual open interest among the three selected contracts, while Bybit and OKX had nearly equal outstanding exposure.
But the more important conclusion concerns measurement.
Exchange OI figures are only comparable when the instruments, units, timestamps, and counting methods are aligned.
A larger number does not automatically imply deeper liquidity, stronger execution, or greater long-term competitiveness.
For TheBearGrid, open interest is most useful as a measure of outstanding derivatives exposure—one that should be interpreted alongside trading volume, market depth, and funding conditions.
The objective is not simply to identify the largest figure, but to understand what that figure actually measures.
Related Research
- Open Interest Explained: What It Measures in Crypto Markets
- Why Derivatives Market Share Shifts Between Exchanges
- Why Crypto Exchange Trading Volume Doesn’t Equal Liquidity
- What Is a Funding Rate in Crypto Perpetual Futures?
Sources and Methodology
- 21 BTC — Bitcoin Derivatives Dashboard — Source of the November 9, 2026, 11:20 UTC cross-exchange snapshot. Values reported by the dashboard are based on the exchanges’ public APIs.
- Binance Futures API — Open Interest — Official contract-level OI documentation.
- Bybit V5 API — Open Interest — Official response fields, including single-sided OI.
- Bybit — Update to the Open Interest Calculation Method — June 2026 methodology change.
- OKX API v5 Documentation — Official contract and open-interest documentation.
- CME Group — Open Interest — Background on futures open-interest measurement.
Data note: This is a historical point-in-time comparison, not a live market-data feed. The snapshot values were taken from a third-party dashboard; TheBearGrid did not independently capture simultaneous raw API responses. The three-contract sample is not representative of the entire global derivatives market.
Disclaimer: This research is for informational purposes only and does not constitute investment advice. Derivatives trading involves leverage, liquidation, funding, and counterparty risks.