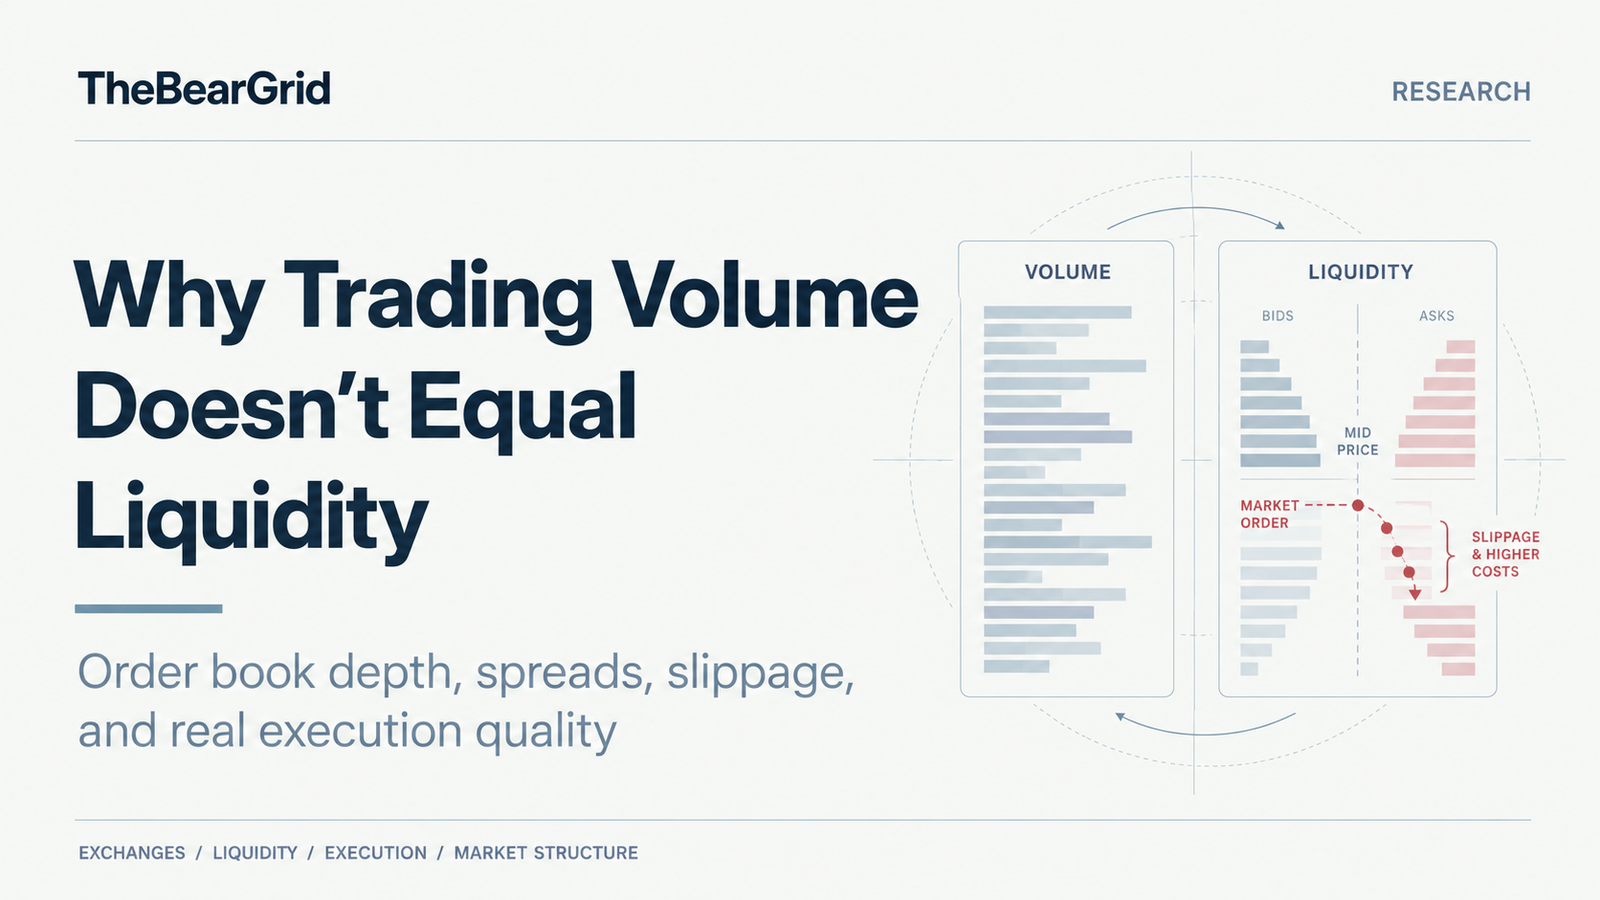
Two crypto exchanges report similar daily trading volumes.
Both offer Bitcoin perpetual futures, competitive trading fees, and substantial market activity.
Yet a trader attempting to execute the same order may experience significantly different results.
On one exchange, the order fills near the quoted market price. On the other, the order consumes several levels of the order book, resulting in a noticeably worse average execution price.
How can two markets with similar trading volumes offer such different trading conditions?
The answer is that trading volume and market liquidity measure different things.
Volume tells us how much trading occurred. Liquidity describes how efficiently orders can be executed at prices close to the prevailing market.
For traders, the distinction directly affects execution costs. For exchange analysts, it raises a broader question: how much does reported trading activity reveal about the actual quality of a trading venue?
Table of Contents
Why Trading Volume Is Not the Same as Liquidity
Trading volume measures the total amount of an asset or contract traded over a specified period.
For example, an exchange might report $5 billion in BTC perpetual futures volume over 24 hours.
This indicates substantial trading activity, but it does not reveal how much liquidity is available for the next order.
A trading venue could generate high volume through frequent transactions while maintaining relatively limited resting orders near the current market price.
Another venue might report lower daily volume while consistently maintaining a deeper and more stable order book.
These differences arise because trading volume is a historical flow measure, while displayed order book liquidity is a snapshot of available trading interest.
Volume Measures Activity, Not Execution Capacity
Consider two hypothetical BTC-USDT perpetual markets.
| Metric | Exchange A | Exchange B |
|---|---|---|
| 24-hour trading volume | $1 billion | $1 billion |
| Available order book depth | Relatively deep | Relatively thin |
| Bid-ask spread | Tight | Wider |
| Expected large-order execution | Lower price impact | Higher price impact |
Illustrative comparison, not actual exchange data.
Both markets report identical trading volume.
However, a trader submitting a large market order may experience considerably different execution prices.
This is why trading volume should be understood as an indicator of market activity rather than a direct measurement of executable liquidity.
The distinction is particularly important in crypto derivatives, where frequent position adjustments, hedging activity, and algorithmic trading can generate substantial turnover.
A high-volume market is not necessarily an inexpensive market to trade.
Order Book Depth: Where Executable Liquidity Exists
The order book provides a more direct view of the liquidity currently displayed in a trading market.
It contains resting buy and sell orders organized by price.
Buy orders are called bids, while sell orders are called asks.
The highest bid represents the best displayed buying price. The lowest ask represents the best displayed selling price.
When a trader submits a market buy order, the exchange matches it against available sell orders, beginning with the lowest ask.
If the order is larger than the quantity available at the best ask, the remaining quantity is matched against additional price levels.
This process can result in a worse average execution price.
What Is Market Depth?
Market depth measures the quantity or notional value of orders available within a specified distance from the market price.
For example, analysts frequently examine the amount of liquidity available within 0.1%, 1%, or 2% of the mid-price.
The mid-price is calculated as:
Mid-Price = (Best Bid + Best Ask) ÷ 2
Suppose Bitcoin has a mid-price of $100,000.
A 1% depth calculation examines displayed liquidity within approximately $99,000 to $101,000.
The bid side measures available buying interest below the mid-price.
The ask side measures available selling interest above it.
These two sides should be evaluated separately.
For a trader entering a long position with a market buy order, the ask-side depth matters most for immediate entry execution.
For a trader selling or closing a long position, bid-side depth becomes more relevant.
Why Depth Must Be Evaluated at Multiple Price Levels
A market may display substantial liquidity within 2% of its mid-price but relatively little liquidity within 0.1%.
In that case, a large order might eventually be filled, but only after consuming orders significantly away from the best available price.
This distinction matters because liquidity located far from the market price provides less protection against immediate execution costs.
For example:
| Depth measure | Primary interpretation |
|---|---|
| 0.1% depth | Liquidity concentrated very close to the current price |
| 1% depth | Capacity to absorb moderately larger orders |
| 2% depth | Broader displayed liquidity across a wider price range |
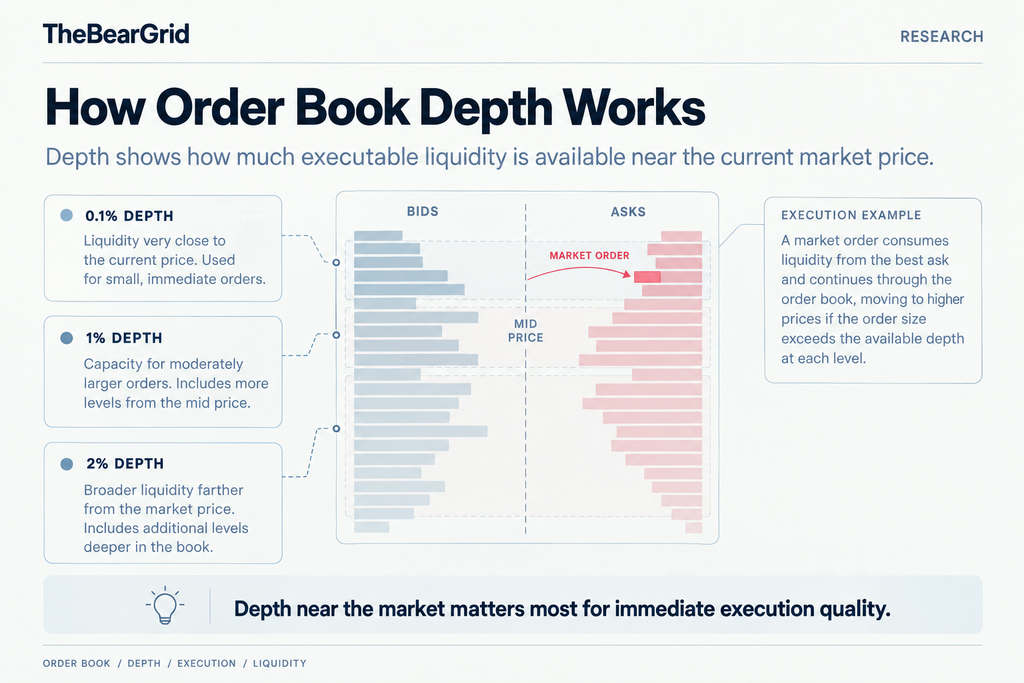
The thresholds are analytical conventions, not universal definitions of good or bad liquidity.
A meaningful comparison requires consistent contract specifications, reporting units, and observation times.
Importantly, displayed depth is not guaranteed execution capacity.
Orders may be canceled or replaced before a trade reaches them, and additional liquidity can appear as market conditions change.
Bid-Ask Spread and Slippage: The Hidden Cost of Trading
Market depth explains how much liquidity is available across price levels.
Bid-ask spreads and slippage help explain the cost of accessing that liquidity.
Bid-Ask Spread
The bid-ask spread is the difference between the highest bid and the lowest ask.
Consider a BTC perpetual futures market with:
- Best bid: $99,990
- Best ask: $100,010
- Mid-price: $100,000
The spread is:
$100,010 − $99,990 = $20
Expressed relative to the mid-price:
($20 ÷ $100,000) × 100 = 0.02%
A trader immediately buying at the ask and selling at the bid would face a round-trip spread cost of $20 per BTC, assuming unchanged quotes, sufficient displayed size, and no trading fees.
A tighter spread generally indicates lower immediate execution costs for small trades.
However, the spread alone does not reveal whether sufficient liquidity exists for a larger order.
Slippage and Order Book Impact
Slippage refers to the difference between an expected or reference price and the actual execution price.
Its measurement depends on the chosen reference, such as the best available quote, mid-price, or price observed when the order was submitted.
Suppose a trader wants to buy 1 BTC.
If only 0.2 BTC is available at the best ask, the remaining 0.8 BTC must be filled at other prices, assuming the trader uses a market order and sufficient offers exist.
The average execution price may therefore be higher than the initial best ask.
This additional cost is often described as walking the order book.
For larger traders, the cost of moving through multiple price levels can exceed the visible bid-ask spread.
Execution quality depends on both the price available at the top of the order book and the liquidity available behind it.
Worked Example: Same Trading Volume, Different Execution Costs
Consider two hypothetical BTC-USDT perpetual futures markets.
Each reports $1 billion in trading volume over the previous 24 hours.
At the moment of observation, both have a mid-price of $100,000.
A trader submits a market buy order for 1 BTC.
The available ask-side liquidity differs between the two exchanges.
Exchange A: Deeper Liquidity Near the Market
| Ask price | Available quantity |
|---|---|
| $100,010 | 0.7 BTC |
| $100,020 | 0.6 BTC |
The first 0.7 BTC fills at $100,010.
The remaining 0.3 BTC fills at $100,020.
The volume-weighted average execution price is:
(0.7 × $100,010) + (0.3 × $100,020)
= $100,013
Relative to the $100,000 mid-price, the execution cost is $13, or 1.3 basis points.
Exchange B: Thinner Liquidity Near the Market
| Ask price | Available quantity |
|---|---|
| $100,050 | 0.2 BTC |
| $100,200 | 0.3 BTC |
| $100,500 | 0.5 BTC |
The trader’s 1 BTC order consumes all three levels.
The average execution price becomes:
(0.2 × $100,050) + (0.3 × $100,200) + (0.5 × $100,500)
= $100,320
Relative to the same $100,000 mid-price, the execution cost is $320, or 32 basis points.
Comparing the Results
| Metric | Exchange A | Exchange B |
|---|---|---|
| Reported 24h volume | $1 billion | $1 billion |
| Best ask | $100,010 | $100,050 |
| Average execution price | $100,013 | $100,320 |
| Cost relative to mid-price | $13 | $320 |
| Execution cost in basis points | 1.3 bps | 32 bps |
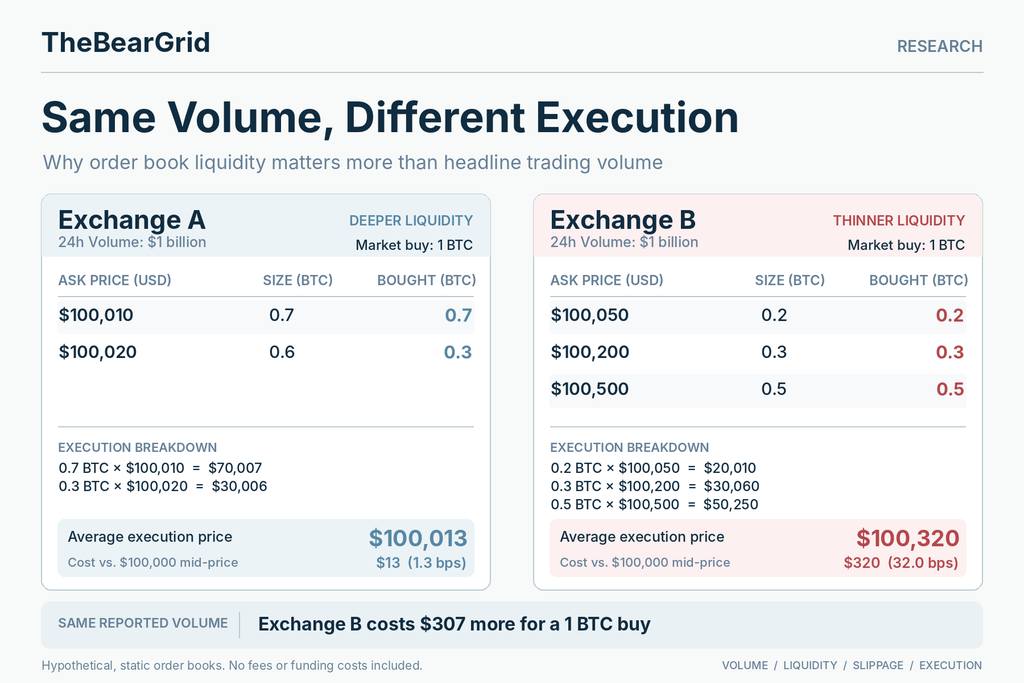
All figures are hypothetical. The calculation assumes that displayed orders remain available, the entire 1 BTC order is filled, and the order book does not change during execution. Trading fees and funding costs are excluded.
Despite identical reported trading volumes, Exchange B produces an execution price that is $307 worse for the same 1 BTC buy order.
The example is not evidence that one real exchange is better than another.
It demonstrates how trading costs can differ when reported volume is similar but available liquidity is distributed differently.
It also explains why traders should examine bid and ask depth for the order size they intend to execute.
Market Makers, Trading Incentives, and Fragile Liquidity
A significant portion of displayed crypto exchange liquidity is supplied by market makers.
Market makers continuously submit buy and sell orders, attempting to earn compensation for providing liquidity while managing inventory, volatility, and execution risk.
They can help maintain narrow spreads and improve available depth.
However, the presence of market-making activity does not guarantee that liquidity will remain stable under all conditions.
How Exchange Incentives Influence Liquidity
Crypto exchanges compete to attract market makers through mechanisms such as:
- Maker fee discounts or rebates.
- Volume-based fee tiers.
- Market-making programs and liquidity incentives.
- Technology and connectivity arrangements that reduce execution latency.
These programs influence the economics of providing liquidity.
For example, a market maker receiving favorable maker fees may find it economical to post tighter quotes than would otherwise be profitable.
This can improve trading conditions when competing liquidity providers are actively quoting.
However, incentive programs can also increase transaction turnover without producing proportionate improvements in the depth or stability of the order book.
The distinction matters when evaluating exchange competitiveness.
Higher market-making volume does not necessarily imply proportionally stronger execution liquidity.
Why Liquidity Can Disappear During Volatility
Market makers take risks when providing executable quotes.
A market maker posting a bid can be filled just before prices fall further. A market maker posting an ask can be filled just before prices rise.
During periods of elevated volatility, these risks can increase.
Liquidity providers may respond by widening spreads, reducing order sizes, or withdrawing quotes.
As a result, a market that appears liquid during calm conditions can become considerably more expensive to trade during market stress.
This creates an important limitation for liquidity rankings based on isolated snapshots.
Liquidity quality depends not only on how much depth is displayed, but also on how reliably that depth remains available across changing market conditions.
Repeated order book observations and realized execution data can provide a more complete picture than a single snapshot.
Does a High Volume-to-Depth Ratio Indicate Wash Trading?
A market reporting extremely high trading volume relative to its available order book depth may deserve closer examination.
Possible explanations include high-frequency turnover, rapid liquidity replenishment, concentrated trading activity, or artificially generated transactions.
Wash trading involves transactions designed to create misleading trading activity rather than genuine changes in economic exposure.
However, a high volume-to-depth ratio is not sufficient evidence of wash trading.
Order book depth is a snapshot, whereas volume accumulates over time.
A market can legitimately process substantial volume against repeatedly replenished liquidity.
Therefore, suspicious patterns require additional analysis of trade frequency, transaction sizes, order cancellations, market behavior, and other available data.
Why Crypto Exchange Rankings Can Disagree
The distinction between trading volume and liquidity is reflected in the methodologies used by major crypto market data providers.
However, these providers do not all measure the same thing.
Some assess the tradability of individual trading pairs.
Others evaluate exchanges across broader categories, including security, regulation, and operational performance.
Comparing their scores without understanding the methodology can lead to misleading conclusions.
CoinGecko: Liquidity as a Core Exchange Quality Component
CoinGecko revised its exchange Trust Score methodology in 2026.
Under its updated methodology, the overall score incorporates liquidity, cybersecurity, regulation, past incidents, and proof of reserves.
Liquidity carries a 50% weighting within the underlying scoring framework.
The liquidity assessment examines factors including reported volume consistency, order book depth, and trading activity across selected markets.
This approach reflects a recognition that reported trading volume alone is an incomplete measure of exchange quality.
However, CoinGecko’s exchange Trust Score applies to spot exchanges.
Its published methodology states that derivatives exchanges are not currently assigned the same Trust Score and are ranked using reported open interest and trading volume.
This distinction is important for analysts focused on perpetual futures.
A spot exchange quality score should not automatically be interpreted as a direct assessment of that venue’s derivatives liquidity.
Source: CoinGecko Trust Score Methodology.
Kaiko: Market Depth and Broader Exchange Quality
Kaiko’s exchange ranking uses a multidimensional methodology that includes liquidity, data quality, security, governance, and technology.
Its published exchange liquidity framework considers trading activity, depth within ±1% of prevailing prices, distribution across assets, and changes in liquidity conditions over time.
This approach recognizes that liquidity is not simply the number of transactions completed.
A market can appear active while lacking the depth needed for efficient larger-order execution.
Kaiko also examines relationships between reported trading activity and available liquidity when evaluating potential data quality concerns.
Its broader ranking framework shows why execution quality should be assessed alongside operational and market infrastructure considerations.
Source: Kaiko Exchange Ranking.
CoinMarketCap: Evaluating Potential Execution Costs
CoinMarketCap’s market-pair liquidity methodology takes an execution-oriented approach.
Rather than treating trading volume as sufficient evidence of liquidity, its published framework evaluates order book conditions for different hypothetical trade sizes.
It considers factors such as available depth and estimated slippage.
This approach addresses a practical question:
How much of an asset can be traded before execution prices move materially away from the current market?
A market that performs well for a $1,000 order may not provide equally attractive execution for a $100,000 order.
Therefore, liquidity is partly dependent on the size and direction of the intended transaction.
Source: CoinMarketCap Liquidity Score Methodology.
Why These Rankings Should Not Be Treated as Interchangeable
| Provider | Main evaluation approach | Important limitation |
|---|---|---|
| CoinGecko | Exchange quality and liquidity assessment | Spot Trust Score is not a derivatives liquidity score |
| Kaiko | Market depth, activity, and broader exchange quality | Overall exchange ranking covers more than liquidity |
| CoinMarketCap | Order book-based liquidity and estimated execution costs | Results depend on trade size and methodology |
The comparison does not establish which methodology is universally superior.
Instead, it demonstrates that different rankings answer different questions.
An exchange can rank highly by reported volume without necessarily ranking equally highly by executable liquidity or operational quality.
The analytical objective should be to choose the metric that matches the question being investigated.
What This Means for Perpetual Futures Traders
Liquidity analysis is particularly important in perpetual futures because leverage increases the financial consequences of unfavorable execution.
For example, a trader with $1,000 in margin using 10× leverage can establish approximately $10,000 in notional exposure.
If poor execution creates an additional 0.5% cost relative to the intended entry price, that corresponds to approximately $50 on a $10,000 position.
That is equivalent to 5% of the trader’s initial $1,000 margin, before accounting for trading fees or funding.
The underlying market has not necessarily moved 5%.
Instead, the additional execution cost represents a larger share of the capital supporting the leveraged position.
This illustrates why liquidity and execution quality matter even when trading fees appear competitive.
Liquidity and Liquidation Risk Are Connected
Thin order books can also amplify the price impact of forced position closures.
When large numbers of leveraged positions are liquidated, exchanges may need to execute or transfer exposure in stressed market conditions.
If available liquidity is insufficient, the resulting transactions can contribute to further price movements.
For a detailed explanation of these mechanisms, see How Crypto Futures Liquidation Works: Mark Price, Margin, and Risk.
Liquidity therefore affects more than the cost of opening positions.
It can also influence the market’s ability to absorb rapid position reductions during periods of elevated volatility.
Trading Volume, Open Interest, and Market Depth Answer Different Questions
These three metrics provide complementary information.
Trading volume measures the amount traded during a period.
Open interest measures outstanding derivatives exposure.
Order book depth measures displayed liquidity available at different price levels.
A market may report high volume and open interest while showing relatively thin liquidity near the current market price.
In such conditions, the market may have substantial outstanding exposure relative to its immediate capacity to absorb aggressive orders.
However, the relationship does not automatically predict a liquidation cascade or future price direction.
For more on outstanding derivatives exposure, see Crypto Open Interest Explained: How to Read OI.
For a broader discussion of how exchanges compete for traders, see How Crypto Exchanges Compete for Perpetual Futures Traders.
The broader implication is that exchange competitiveness should not be assessed using trading volume or advertised fees alone.
Execution quality, liquidity resilience, and the exchange’s risk infrastructure all influence the experience of trading perpetual futures.
Final Takeaway
Trading volume is an important indicator of activity, but it is not a complete measure of crypto exchange liquidity.
A high-volume exchange may offer substantial trading opportunities while still producing unfavorable execution for certain order sizes or under stressed market conditions.
Order book depth, bid-ask spreads, and estimated or realized slippage provide additional information about how efficiently a market can absorb transactions.
The stability of that liquidity over time is equally important.
For exchange research, this distinction changes how trading venues should be compared.
Rather than assuming that the largest reported trading volume identifies the strongest market, analysts need to examine whether that activity is supported by reliable, executable liquidity.
The exchange that processes the most trading volume is not necessarily the exchange that delivers the best execution.
For traders, that difference affects the actual cost of entering and exiting positions.
For the exchange industry, it reveals a deeper dimension of competition: the ability to consistently provide efficient execution, not merely generate trading activity.
Related Research
- How Crypto Exchanges Compete for Perpetual Futures Traders — How trading costs, liquidity, and infrastructure shape exchange competition.
- What Are Perpetual Futures? — Understanding perpetual futures contracts and their trading mechanics.
- Crypto Open Interest Explained: How to Read OI — Understanding outstanding exposure in crypto derivatives markets.
- How Crypto Futures Liquidation Works — How margin, mark prices, and liquidation engines affect leveraged positions.
References
- CoinGecko — Trust Score Methodology. Updated October 2, 2026. Exchange scoring components and liquidity evaluation.
- Kaiko — Exchange Ranking. Exchange-level methodology covering liquidity, data quality, security, and operational factors.
- Kaiko — Understanding Centralized Exchange Liquidity Data. Definitions and applications of order book depth, spreads, and hypothetical execution slippage.
- Kaiko — Identify Wash Trading and Volume Quality. Discussion of trading volume relative to available liquidity.
- CoinMarketCap — Liquidity Score Methodology. Order book-based liquidity evaluation and estimated execution costs.
- Binance Academy — Bid-Ask Spread and Slippage Explained. Updated July 6, 2026.
- CME Group — Assessing Liquidity: Revisiting Whether Book Depth Is Sufficiently Representative. Research into market depth, volume, and execution quality during volatile conditions.
Source review date: October 28, 2026. All numerical trading examples are hypothetical and do not represent observed trading conditions or actual exchange rankings. Published methodologies and exchange operating conditions may change over time.
Disclaimer: This article is for educational and informational purposes only and does not constitute financial or investment advice. Trading cryptocurrency derivatives involves substantial risk, including liquidation and the potential loss of posted collateral.