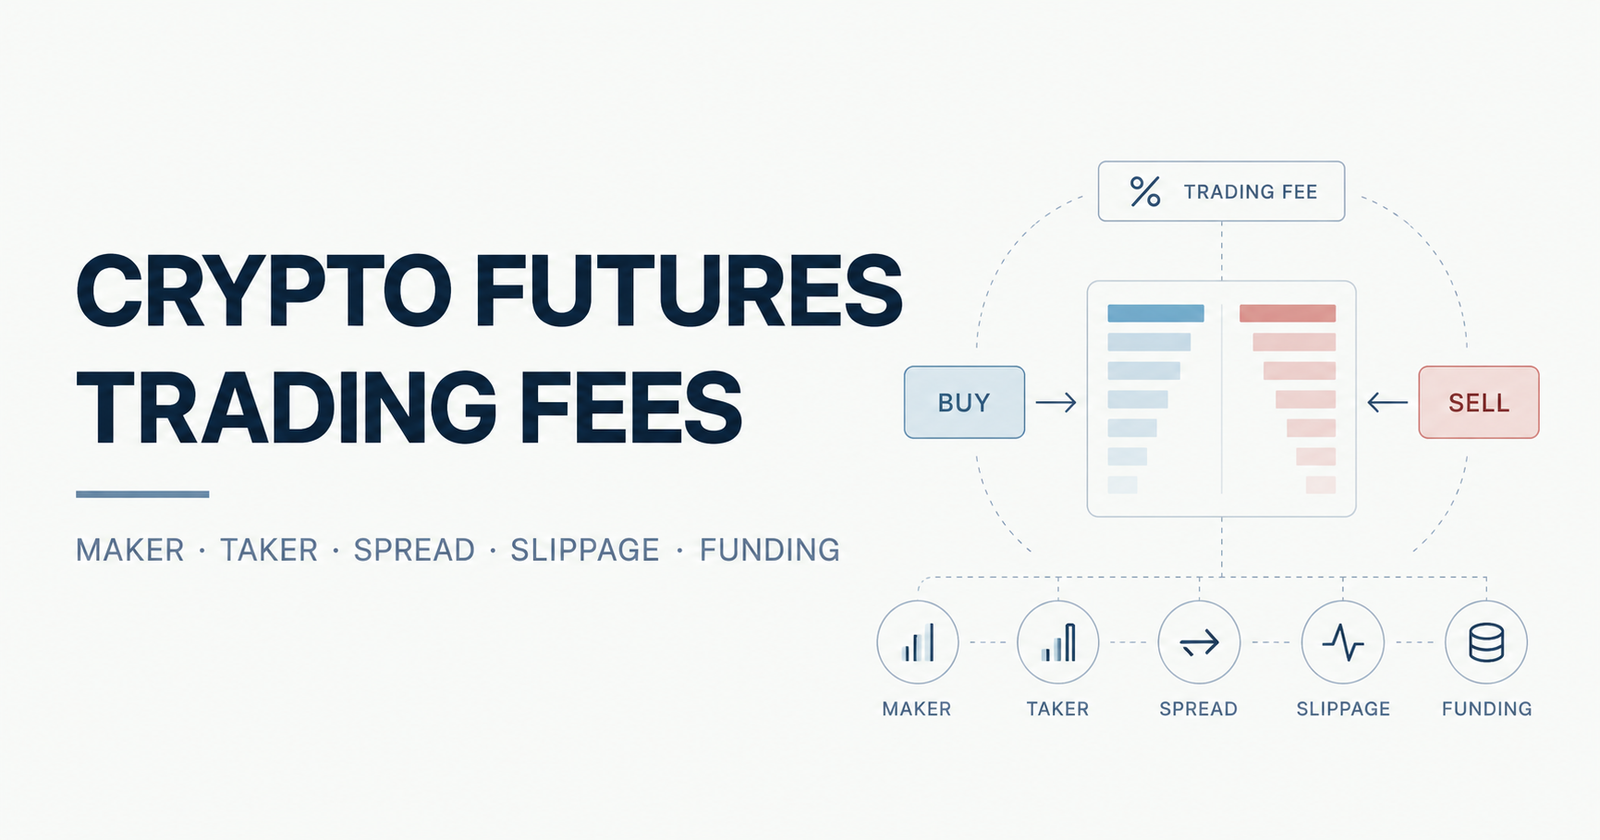
A crypto exchange advertises a futures trading fee of 0.05%.
A trader opens a $20,000 Bitcoin perpetual futures position, expecting the transaction to cost approximately $10.
But after opening and closing the position, the actual cost may be considerably higher.
Trading fees are charged when positions are opened and closed. Market orders may execute at unfavorable prices, while perpetual positions can also incur funding payments.
For leveraged traders, these costs can represent a meaningful percentage of the margin committed to a trade.
This creates an important distinction between an exchange’s advertised trading fees and the actual economics of executing and maintaining a position.
Understanding that difference is essential when comparing perpetual futures trading conditions across crypto exchanges.
Table of Contents
1. What Makes Up the Real Cost of Crypto Futures Trading?
The total cost of trading perpetual futures consists of several components.
Some are explicitly charged by the exchange. Others are embedded in execution prices or arise from maintaining positions over time.
| Cost component | How it arises | When it matters |
|---|---|---|
| Trading commission | Fee charged on executed orders | Opening and closing positions |
| Bid-ask spread | Difference between buying and selling quotes | Immediate execution |
| Slippage and market impact | Execution prices differ from the initial reference price | Especially for larger or urgent orders |
| Funding payments | Transfers between opposing perpetual positions | Holding positions through funding settlements |
| Liquidation-related charges | Exchange-specific risk and liquidation procedures | When liquidation occurs |
These costs are not always additive as separate accounting entries.
For example, an execution-cost calculation measured against the mid-price can already include the effect of crossing the bid-ask spread.
Adding the spread again would double-count part of the cost.
Likewise, funding payments are not conventional exchange trading commissions. They are generally transferred between long and short position holders.
The appropriate comparison therefore depends on whether an analyst is measuring explicit fees, execution shortfall, financing-related transfers, or the overall net result of a trade.
The real cost of a position is determined by its execution prices, applicable fees, funding payments, and any additional charges—not simply the advertised commission rate.
2. Maker vs. Taker Fees: Why Order Type Matters
Crypto derivatives exchanges commonly distinguish between makers and takers.
The difference is based on how an order interacts with the order book.
Maker Orders
A maker provides liquidity by placing an order that rests on the order book until another participant executes against it.
For example, suppose Bitcoin perpetual futures have the following quotes:
- Best bid: $99,990
- Best ask: $100,010
A trader submits a limit buy order at $99,990.
If that order rests on the order book and is subsequently executed by an incoming seller, it is a maker execution.
Exchanges often charge makers lower fees than takers because resting orders contribute to available liquidity.
Some fee programs may offer zero or even negative maker rates, meaning eligible liquidity providers can receive rebates.
However, lower fees do not guarantee better overall trading outcomes.
A maker order may remain unfilled or execute shortly before an unfavorable price movement.
Taker Orders
A taker removes existing liquidity from the order book.
A market buy order generally executes against available ask orders, beginning with the best available price.
Because the order consumes liquidity rather than providing it, a taker fee normally applies.
Taker orders are often used when execution speed is more important than waiting for a specific price.
However, execution at the expected price is not guaranteed.
If insufficient liquidity is available at the best quote, a market order may consume additional order book levels.
This can increase its average execution price.
Does a Limit Order Always Pay Maker Fees?
No.
A limit order can execute immediately if its price crosses the available opposing quotes.
For example, if the best ask is $100,010 and a trader submits a limit buy order at $100,020, the order can immediately execute against available sell orders.
The executed portion would generally be classified as taker activity.
A partially executed limit order can also contain both maker and taker fills.
The classification depends on whether each execution adds or removes liquidity.
What Is Post-Only?
Post-Only is an order instruction designed to prevent immediate taker execution.
If an order would immediately match existing liquidity, the exchange rejects or cancels it according to the applicable rules.
This helps traders avoid unintentionally paying taker fees.
But Post-Only introduces an important trade-off: preventing taker execution can also mean missing the intended trade entirely.
| Order behavior | Typical fee classification | Main trade-off |
|---|---|---|
| Market order | Taker | Fast execution, uncertain final price |
| Resting limit order | Maker | Lower fee potential, uncertain fill |
| Immediately matched limit order | Taker | Price limit, but taker fee applies |
| Post-Only limit order | Maker if executed | May be canceled or remain unfilled |
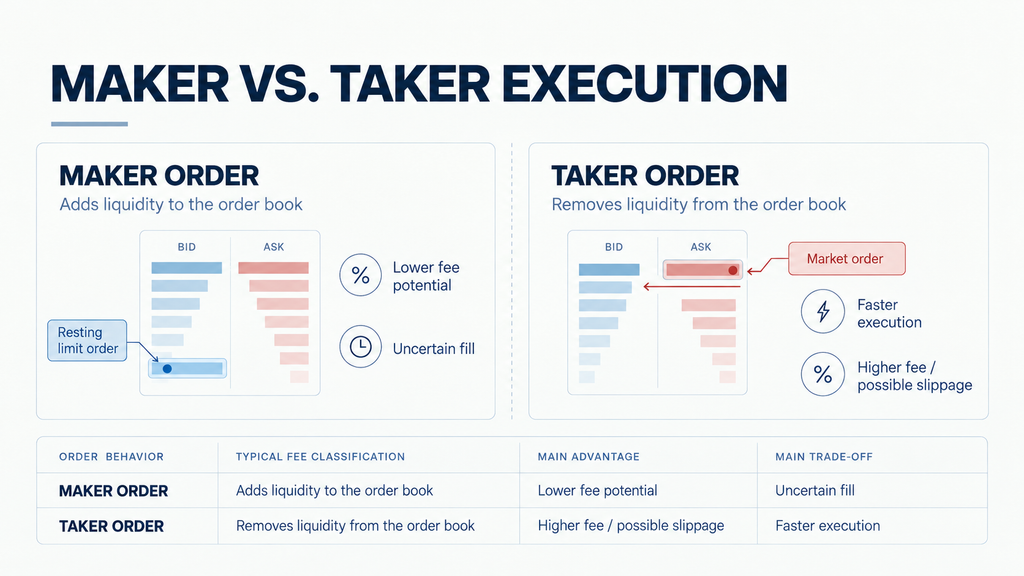
For frequent traders, the difference between maker and taker fees can become substantial over many transactions.
Yet execution probability, timing, and adverse price movements remain just as important as the commission rate.
3. How Crypto Futures Trading Fees Are Calculated
For a standard linear USDT-margined perpetual futures contract, the trading commission is generally calculated as:
Trading Fee = Executed Notional Value × Applicable Fee Rate
The executed notional value depends on the contract quantity and execution price.
For example, consider a $20,000 futures trade with the following hypothetical fee schedule:
- Maker fee: 0.02%
- Taker fee: 0.05%
The maker commission is:
$20,000 × 0.0002 = $4
The taker commission is:
$20,000 × 0.0005 = $10
The difference is $6 for a single execution.
However, traders need to consider both sides of the position.
Opening and Closing Fees
Suppose a trader opens a $20,000 position and later closes it at an unchanged price.
Assume both transactions execute at the same notional value.
| Execution method | Opening fee | Closing fee | Total commission |
|---|---|---|---|
| Maker entry + Maker exit | $4 | $4 | $8 |
| Maker entry + Taker exit | $4 | $10 | $14 |
| Taker entry + Taker exit | $10 | $10 | $20 |
Hypothetical rates. Actual commissions are calculated using the notional value of each execution, which can differ between entry and exit.
This table illustrates why a published fee rate should not be interpreted as the total cost of a completed trade.
A trader opening and closing a position through market orders generally incurs two taker commissions.
If the position is adjusted through multiple transactions, additional commissions may apply.
Why Leverage Changes the Cost Relative to Margin
Trading fees are calculated on executed notional value, not simply the initial margin committed.
This distinction becomes important when leverage is used.
Consider a trader with $1,000 in margin.
Assume a 0.05% taker fee and no changes in execution prices.
| Leverage | Position notional | Entry fee | Entry + Exit fees |
|---|---|---|---|
| 1× | $1,000 | $0.50 | $1 |
| 5× | $5,000 | $2.50 | $5 |
| 10× | $10,000 | $5 | $10 |
| 20× | $20,000 | $10 | $20 |
With the same margin, increasing leverage allows the trader to establish greater notional exposure.
That larger position generates higher absolute trading fees.
At 20× leverage, the hypothetical round-trip commission is $20, equivalent to 2% of the trader’s original $1,000 margin.
The underlying commission rate remains 0.05% per execution.
But its financial impact relative to committed capital is much larger.
If the notional position size remains unchanged, adjusting leverage alone does not change the commission charged on that fixed execution amount.
Leverage increases absolute trading costs when it is used to increase position size, while also magnifying the cost relative to committed margin.
4. Why Spreads and Slippage Matter Beyond Trading Fees
Commission is only one part of the cost of entering or exiting a position.
The prices available in the order book also affect the actual outcome.
The Cost of Crossing the Bid-Ask Spread
Consider a market with:
- Best bid: $99,990
- Best ask: $100,010
- Mid-price: $100,000
The bid-ask spread is $20.
A trader buying at the ask pays $10 above the mid-price.
A trader immediately selling at the bid receives $10 below the mid-price.
If a trader buys and immediately sells one BTC under unchanged market conditions, the price difference is $20 before commissions.
This is an implicit execution cost rather than a separate fee charged to the trader’s account.
Slippage From Larger Orders
Now assume the trader wants to buy significantly more BTC than is available at the best ask.
The order may need to execute against several higher-priced sell orders.
As a result, the volume-weighted average execution price can be worse than the price initially displayed at the top of the order book.
The additional price impact depends on the quantity available across price levels.
For this reason, slippage becomes especially important for larger orders and markets with limited liquidity.
A trading venue offering lower commissions may still be more expensive if its order book produces consistently unfavorable executions.
Avoiding Double-Counting Execution Costs
When comparing trading costs, analysts must define a consistent price benchmark.
For example, if the benchmark is the mid-price immediately before an order, the difference between that reference and the actual execution price may include both:
- The cost of crossing the spread.
- Additional impact from consuming order book depth.
It would be incorrect to add the entire bid-ask spread again if that cost is already included in the execution shortfall.
The same principle applies when comparing exchanges.
Execution costs should be measured using comparable timestamps, instruments, order sizes, directions, and reference-price definitions.
For a broader explanation of order book depth and exchange liquidity, see Why Crypto Exchange Trading Volume Doesn’t Equal Liquidity.
5. Worked Example: Maker vs. Taker Trading Costs
Consider a hypothetical trader who opens and later closes a 0.2 BTC long position.
Assume the market’s mid-price is $100,000 at both the entry and exit observations.
The trader’s reference notional value is:
0.2 BTC × $100,000 = $20,000
The following fee rates apply:
- Maker: 0.02%
- Taker: 0.05%
We will compare two execution scenarios.
These are hypothetical executions, not actual exchange data.
Scenario A: Market Orders on Entry and Exit
The trader enters through a market buy order and exits through a market sell order.
Assume the average executed prices are:
| Transaction | Average execution price |
|---|---|
| Buy 0.2 BTC | $100,030 |
| Sell 0.2 BTC | $99,970 |
The difference between entry and exit prices is:
$99,970 − $100,030 = -$60 per BTC
For a 0.2 BTC position:
-$60 × 0.2 = -$12
This $12 loss represents the combined effect of the assumed entry and exit execution prices relative to the unchanged reference market.
Now calculate the trading commissions.
Entry notional:
0.2 × $100,030 = $20,006
Entry fee:
$20,006 × 0.0005 = $10.003
Exit notional:
0.2 × $99,970 = $19,994
Exit fee:
$19,994 × 0.0005 = $9.997
Total commissions:
$10.003 + $9.997 = $20
The net trading result before funding is:
-$12 − $20 = -$32
Even though the reference mid-price did not change, the trader lost $32 through execution prices and commissions.
That represents 0.16%, or 16 basis points, of the $20,000 reference notional value.
Scenario B: Resting Maker Orders on Entry and Exit
Now consider a trader who successfully executes both sides using resting limit orders.
Assume:
| Transaction | Execution price |
|---|---|
| Buy 0.2 BTC | $99,990 |
| Sell 0.2 BTC | $100,010 |
The difference between the two execution prices is:
$100,010 − $99,990 = $20 per BTC
For 0.2 BTC:
$20 × 0.2 = +$4
The trader has captured a favorable execution-price difference of $4 before commissions.
Entry fee:
$19,998 × 0.0002 = $3.9996
Exit fee:
$20,002 × 0.0002 = $4.0004
Total commissions:
$3.9996 + $4.0004 = $8
The net result before funding is:
$4 − $8 = -$4
Comparing Both Scenarios
| Metric | Taker Entry + Exit | Maker Entry + Exit |
|---|---|---|
| Position size | 0.2 BTC | 0.2 BTC |
| Reference notional | $20,000 | $20,000 |
| Gross execution P&L | -$12 | +$4 |
| Total trading commissions | $20 | $8 |
| Net P&L before funding | -$32 | -$4 |
| Cost as % of reference notional | 0.16% | 0.02% |
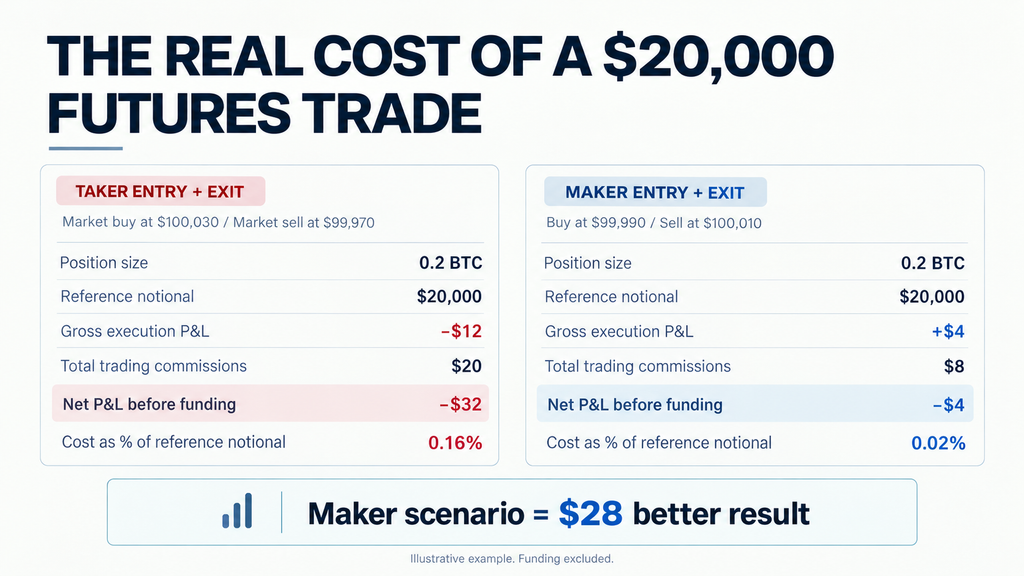
Illustrative calculation using unchanged reference mid-prices. Assumes full execution of all orders, no funding payments, no additional charges, and no unrelated price changes.
The maker scenario produces a $28 better result.
However, the example should not be interpreted as proof that maker orders are always superior.
The comparison assumes that the trader successfully obtains favorable maker fills at both entry and exit.
In real markets, those fills may not occur.
Orders can remain unexecuted, be partially filled, or execute immediately before adverse price movements.
A trader seeking to close a risky position may also prefer immediate execution rather than waiting for a maker fill.
Lower commission rates are valuable, but they do not eliminate the execution risks associated with passive orders.
Why This Matters for Leveraged Traders
Suppose the same $20,000 position is supported by $1,000 in initial margin at 20× leverage.
The $32 cost in Scenario A equals:
$32 ÷ $1,000 × 100 = 3.2% of initial margin
That is before any funding payments.
The cost represents only 0.16% of the reference notional exposure, but 3.2% of the trader’s initial margin.
This is why relatively small trading costs can materially affect leveraged trading performance.
6. Funding Fees and the Cost of Holding a Position
Trading commissions occur when orders are executed.
Funding payments arise from holding perpetual futures exposure across eligible settlement times.
The two mechanisms should be evaluated separately.
Funding rates can be positive or negative.
When funding is positive, long positions generally pay short positions.
When funding is negative, short positions generally pay long positions.
The payment is based on the applicable position value and funding rate.
For standard linear perpetual contracts, the basic relationship is:
Funding Payment = Position Notional Value × Funding Rate
The exact notional calculation and settlement methodology depend on the contract and exchange.
Adding Funding to the Previous Example
Return to the hypothetical $20,000 BTC long position.
Assume the trader holds it through one funding settlement at a positive rate of 0.01%.
If the relevant position value at settlement is $20,000:
$20,000 × 0.0001 = $2
The long trader pays $2 in funding.
The two illustrative trading outcomes therefore become:
| Cost measure | Taker scenario | Maker scenario |
|---|---|---|
| Net P&L before funding | -$32 | -$4 |
| One funding payment | -$2 | -$2 |
| Net P&L after funding | -$34 | -$6 |
Assumes both positions remain eligible through one identical funding settlement and have the same $20,000 settlement notional.
This additional payment does not change the original trading commissions.
It changes the overall financial result of holding the position.
Funding Is Not a Fixed Daily Fee
A common mistake is to assume that the currently displayed funding rate will apply unchanged throughout the holding period.
In practice, funding rates can change.
Settlement frequency can also differ between contracts or change under exchange-specific rules.
Two venues displaying the same funding rate per settlement may have different cumulative funding costs if their settlement intervals differ.
Additionally, funding can be received rather than paid.
For example, under positive funding, a short position may receive a payment that offsets part of its trading expenses.
However, future funding receipts cannot be assumed to remain positive or sufficient to cover execution costs.
For the detailed mechanism, see Crypto Funding Rate Explained: How It Works.
Trading Costs and Liquidation Risk
Trading and funding expenses can also influence the amount of collateral available to support leveraged positions.
If funding payments reduce the margin supporting an isolated position, its liquidation threshold may move closer to the current mark price.
Trading fees and other account charges may also affect available equity, depending on the exchange’s margin accounting.
A position’s risk is therefore not determined solely by the underlying market price.
The costs of opening, maintaining, and closing exposure can influence its net performance and margin condition.
For more on how exchanges manage positions with insufficient collateral, see How Crypto Futures Liquidation Works.
7. How to Compare Trading Costs Across Crypto Exchanges
An exchange comparison based only on advertised maker and taker fee rates provides an incomplete picture.
Different exchanges can have different fee schedules, funding mechanisms, liquidity conditions, and execution outcomes.
The relevant cost also depends on how the trader actually uses the exchange.
Compare the Fee Tier That Actually Applies
Advertised headline rates may not match the fees charged to a particular account.
Applicable rates can depend on factors such as:
- The specific derivatives product.
- Trading volume and VIP eligibility.
- Maker or taker execution.
- Geographic or account-specific conditions.
- Eligible discounts, rebates, or promotional arrangements.
A fee comparison should use the rates available to the trader for the specific contract being evaluated.
It should not assume that the lowest advertised institutional or market-making tier applies to every account.
Evaluate Execution Costs for the Intended Order Size
A trader executing a $1,000 order may experience different liquidity conditions from one executing $100,000.
A venue offering low commissions may still produce relatively expensive execution for larger orders if market depth is limited.
The analysis should consider available order book depth, expected price impact, and realized slippage.
These measurements should be based on comparable order sizes and observation times.
The goal is to estimate the actual cost of obtaining or exiting exposure, not simply compare exchange fee schedules.
Consider the Holding Period
A trader opening and closing positions within minutes faces a different cost structure from one maintaining perpetual exposure for several days.
Short-horizon strategies may be especially sensitive to entry and exit commissions, spreads, and execution delays.
Longer holding periods may accumulate more funding payments, depending on the funding rates and settlement schedule.
The relevant cost comparison therefore depends on the expected holding period and whether the strategy typically pays or receives funding.
A Practical Exchange Cost Framework
| Evaluation factor | Key question |
|---|---|
| Maker and taker commissions | What rates apply to the actual account and contract? |
| Execution price | What average price can the intended order obtain? |
| Market depth | How much liquidity is available near the market price? |
| Order execution | Can the strategy reliably obtain maker fills? |
| Funding | What is the cumulative funding cost over the intended holding period? |
| Margin and liquidation rules | How could costs and market stress affect the position? |
For an isolated, completed linear futures trade, the net result can be expressed as:
Net Trading P&L = Gross Price P&L − Entry Commissions − Exit Commissions − Net Funding Paid − Other Applicable Charges
Funding received is treated as a negative net funding payment, increasing the result.
Gross price P&L should be calculated from actual execution prices. This already incorporates execution-price effects such as spread crossing and realized slippage relative to the chosen benchmark.
Those costs should not be added again as independent deductions.
For exchange-level comparisons, analysts may additionally measure execution shortfall against a common reference price to isolate how trading conditions differ.
Why the Lowest Fee Exchange Is Not Always the Cheapest
Consider two hypothetical exchanges.
Exchange A charges a relatively high taker commission but provides deep liquidity and tight spreads.
Exchange B charges a lower taker commission but has a thinner order book.
A large market order may execute more efficiently on Exchange A despite the higher advertised fee.
Conversely, for smaller trades in liquid markets, differences in commission schedules may represent a more meaningful share of total cost.
There is no universal answer independent of order size, execution method, and trading conditions.
This is why an exchange’s competitiveness must be evaluated through actual trading economics rather than a single advertised percentage.
For a broader industry perspective, see How Crypto Exchanges Compete for Perpetual Futures Traders.
Conclusion
The real cost of trading crypto perpetual futures extends beyond maker and taker commissions.
Trading fees are charged on executed notional value, while spreads and slippage influence the prices at which orders are filled.
Funding payments introduce an additional cost or potential receipt when positions are maintained through settlement times.
Leverage increases the importance of these costs by allowing traders to control larger exposures relative to the capital committed.
The distinction between maker and taker execution also matters. Lower maker fees can reduce costs, but favorable passive execution is not guaranteed.
For traders, this means a lower advertised fee does not necessarily produce a better outcome.
For exchange analysts, it means fee schedules should be considered alongside liquidity, execution quality, funding mechanisms, and risk infrastructure.
The cheapest exchange on paper is not necessarily the cheapest exchange to trade on.
Understanding the complete cost structure provides a more meaningful basis for evaluating perpetual futures trading conditions.
Related Research
- What Are Perpetual Futures? — The mechanics of perpetual futures contracts and leveraged exposure.
- Crypto Funding Rate Explained: How It Works — How funding payments influence the cost of holding perpetual positions.
- Why Crypto Exchange Trading Volume Doesn’t Equal Liquidity — Why market depth, spreads, and slippage matter beyond reported volume.
- How Crypto Futures Liquidation Works — How margin requirements, mark prices, and liquidation processes affect traders.
- How Crypto Exchanges Compete for Perpetual Futures Traders — An examination of fees, liquidity, and exchange competitiveness.
References
- Binance — Futures Fee Structure & Calculations. Official documentation covering maker and taker fees and contract-specific calculations. Updated May 1, 2026.
- Binance — What Fees Are Generated in Binance Futures Trading?. Official explanation of commissions, funding fees, and liquidation-related charges. Updated January 5, 2026.
- Binance — Types of Orders on Binance Futures. Official explanation of market, limit, and Post-Only orders. Updated April 7, 2026.
- Bybit — Trading Fee Structure. Fee tiers and maker/taker classifications.
- Bybit — Post-Only Order. Official documentation explaining maker-only order behavior and cancellation conditions. Updated June 17, 2026.
- Bybit — Funding Fee Calculation. Official explanation of perpetual funding settlement and calculation. Updated May 12, 2026.
- Bybit — P&L Calculations (USDT Perpetual and Expiry Contracts). Official explanation of realized and closed P&L, including commissions and funding. Updated August 12, 2026.
Source review date: October 30, 2026. Trading examples, fee rates, and execution prices are hypothetical unless explicitly identified otherwise. Exchange fees, product specifications, and funding rules may change.
Disclaimer: This article is intended for educational and informational purposes only and does not constitute financial or investment advice. Crypto derivatives involve significant risk, including liquidation and potential loss of posted collateral.