An exchange can increase its futures trading volume and still lose market share.
That may sound contradictory, but market share measures an exchange’s activity relative to its competitors. When the broader derivatives market expands, an exchange must grow faster than the market to gain share.
This distinction matters because crypto derivatives trading is not distributed evenly across exchanges. Activity can shift as traders respond to changing costs, liquidity conditions, available contracts, and market events.
Some changes reflect genuine improvements in an exchange’s competitive position. Others may be temporary, driven by trading incentives or unusually active markets.
Understanding the difference is essential when interpreting crypto derivatives exchange rankings.
Table of Contents
1. Market Share Is About Relative Growth
The basic calculation is straightforward:
Market Share = Exchange Trading Volume ÷ Total Trading Volume of the Measured Market × 100
A rising volume figure does not guarantee a rising market share. What matters is how quickly an exchange grows compared with the rest of the measured market.
September 2026: A Real Example
CoinMarketCap Research reported approximately $4.06 trillion in derivatives volume across 11 tracked exchanges in September 2026, an 11.4% increase from August.
But the exchanges did not grow at the same pace.
| Exchange | August Share | September Share | Change |
|---|---|---|---|
| Binance | 43.71% | 44.67% | +0.96 pp |
| Gate | 7.53% | 9.72% | +2.19 pp |
| MEXC | 11.77% | 8.16% | −3.61 pp |
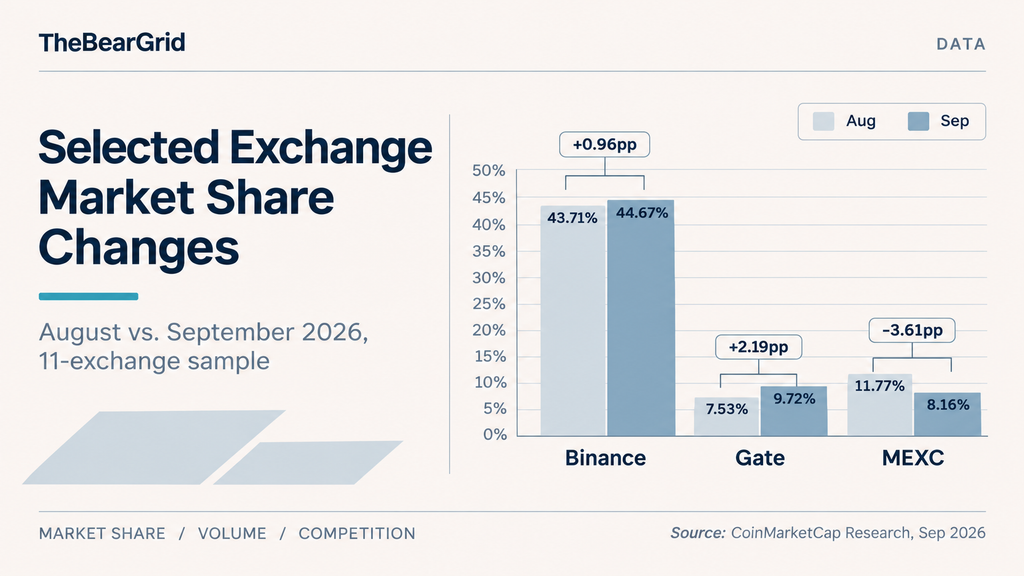
Source: CoinMarketCap Research, September 2026. Figures represent the report’s 11-exchange sample. August shares are derived from the reported September values and percentage-point changes.
Gate’s derivatives volume increased 43.8% during the month, significantly faster than the overall sample. MEXC’s derivatives volume declined 22.8%, causing its share to fall sharply.
Binance also gained share, although its increase was smaller.
These movements demonstrate how quickly the distribution of trading activity can change, even when the overall derivatives market is expanding.
However, the figures do not establish why those changes occurred.
A monthly market-share table measures the outcome. Identifying the underlying drivers requires additional evidence.
For the complete rankings and methodology, see our September 2026 Derivatives Exchange Market Share Report.
2. Trading Fees and Incentives Can Redirect Volume
Trading costs are one reason traders may shift activity between exchanges.
For an occasional trader, a small fee difference may have limited importance. For a market maker or high-frequency strategy executing thousands of transactions, the same difference can materially affect profitability.
Exchanges compete through maker-taker fees, VIP discounts, trading campaigns, and market-maker arrangements.
Bybit, for example, publishes different derivatives fee rates across VIP levels, with eligibility linked to factors such as account assets and trading volume. Its documentation also makes clear that actual fees can vary by region.
The wider competitive implication is straightforward: an exchange that reduces the effective cost of trading may attract additional order flow.
But there is an important distinction between attracting volume and retaining traders.
An incentive program can encourage traders to increase turnover while the promotion is active. When the incentive ends, some activity may disappear or move elsewhere.
Higher reported volume is therefore not necessarily evidence of stronger long-term customer loyalty.
To evaluate whether a fee-driven gain is sustainable, analysts should look at trading activity after the incentive period, alongside liquidity and open interest.
3. Liquidity Creates a Competitive Feedback Loop
For active derivatives traders, liquidity may matter more than a small difference in published fees.
An exchange with deeper order books and tighter bid-ask spreads can offer more attractive execution conditions, particularly for larger orders.
This can create a reinforcing process.
More active trading attracts liquidity providers. Better liquidity can reduce execution costs, making the venue more appealing to other traders. Increased participation may then attract further market-making activity.
Over time, that feedback loop can help an exchange defend or expand its trading share.
However, the relationship is not automatic.
Displayed liquidity can disappear during volatility. A liquid BTC perpetual market does not guarantee equally strong execution in a smaller altcoin contract.
There is also a measurement problem: trading volume records completed transactions, while order-book depth measures available liquidity at a particular time.
An exchange can generate substantial volume through frequent turnover without maintaining consistently deep order books.
This is why a market-share gain becomes more convincing when accompanied by sustained improvements in spreads, executable depth, and trading conditions across comparable derivatives contracts.
For a closer examination, see Why Crypto Exchange Trading Volume Doesn’t Equal Liquidity.
4. Product Availability and Market Events Matter
Traders do not choose an exchange based on fees and liquidity alone.
The contracts available on a platform, its collateral arrangements, and its risk-management rules can influence where activity takes place.
For example, an exchange may attract additional trading when it introduces a contract that competitors do not yet offer. Traders may also prefer a venue with margin arrangements that suit their existing collateral or hedging strategy.
These advantages are often product-specific rather than exchange-wide.
A surge in activity for a newly listed perpetual contract could raise an exchange’s total derivatives volume without improving its competitive position in established BTC or ETH markets.
Market events can also change trading behavior.
Sharp price movements, concentrated liquidations, funding-rate differences, service disruptions, security incidents, and changes in product access may alter how traders allocate their activity.
The effect can be temporary or persistent, depending on the event and the response of market participants.
For researchers, the challenge is separating these possible explanations from the movements visible in aggregated data.
A market-share increase occurring alongside a product launch does not prove that the launch caused the increase. Establishing that relationship would require contract-level activity, event timing, and an appropriate comparison with unaffected markets.
The same caution applies when interpreting changes in exchange rankings after volatility or operational incidents.
5. How to Identify a Durable Market-Share Gain
A single strong month is useful evidence of changing activity, but not enough to establish a lasting competitive advantage.
A stronger assessment compares several measures over consistent periods.
| Indicator | What It Helps Reveal |
|---|---|
| Trading volume share | Whether an exchange is gaining relative trading activity |
| Open interest | Whether outstanding derivatives exposure is also growing |
| Order-book liquidity | Whether execution conditions support the increased activity |
| Activity after incentives | Whether trading persists when promotional support changes |
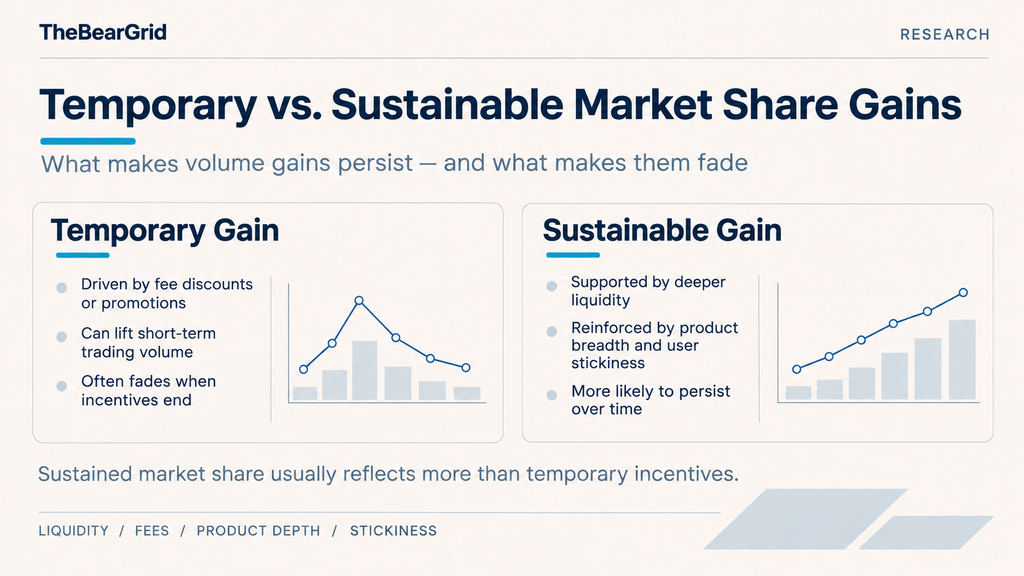
Each measure answers a different question.
Volume Share and Open Interest
Trading volume measures how much was traded during a period. Open interest measures outstanding contracts at a particular point in time.
An exchange could attract substantial short-term turnover without a comparable increase in outstanding positions.
Conversely, growing open interest alongside higher trading volume may indicate that more derivatives exposure is being maintained on the venue.
It still does not prove that new customers have arrived or that the exchange is gaining long-term loyalty. Open interest can also change because of asset prices, contract specifications, and changes in existing positions.
Liquidity and Retention
A stronger signal would be an exchange maintaining higher market share over several comparable periods while also demonstrating stable or improving execution conditions.
That combination suggests trading activity may be supported by more than a temporary promotional campaign.
However, the comparison must use the same exchange universe, contract definitions, and measurement rules.
This is especially important as perpetual futures activity expands beyond centralized exchanges.
Including decentralized perpetual platforms or regulated futures venues can change the market-share denominator significantly.
A reported decline in centralized-exchange share may reflect the growth of previously excluded competitors rather than falling trading volume at the centralized exchange itself.
Researchers must therefore distinguish between two questions:
Is an exchange gaining share within a defined group of competitors?
Or is the structure of the broader derivatives market changing?
Those are related, but different, developments.
Conclusion
Crypto derivatives market share shifts because exchanges do not compete under identical conditions.
Trading costs, liquidity, available contracts, market events, and changes in trader behavior can all influence the distribution of activity.
The September 2026 data provides a useful example. Gate gained share while MEXC declined, even as overall derivatives volume increased across the measured exchanges.
But the numbers show what changed—not necessarily what caused it.
For exchange analysts, the most useful approach is to treat market-share movements as an initial signal, then examine whether the change is supported by open interest, liquidity, and sustained trading activity.
A temporary increase in volume can move an exchange up the rankings. Maintaining that position requires a more durable competitive advantage.
Related Research
- Crypto Derivatives Exchange Market Share: September 2026 — Historical exchange rankings and market-share methodology.
- How Crypto Exchanges Compete for Perpetual Futures Traders — The broader competitive strategies used by derivatives exchanges.
- Why Crypto Exchange Trading Volume Doesn’t Equal Liquidity — Order-book depth, spreads, and execution quality.
- What Is Open Interest in Crypto Futures? — How outstanding derivatives exposure differs from trading volume.
References
- CoinMarketCap Research — September 2026 Exchange Monthly Report. Monthly derivatives volume, exchange rankings, percentage-point changes, and dataset methodology.
- Bybit — Trading Fee Structure. Published derivatives maker-taker fees and VIP tier requirements.
- CoinMarketCap — Market Data Methodology. Trading-volume and market-liquidity measurement considerations.
- CoinGecko — CEX & DEX Trading Activity Report 2026. The evolving distribution of trading activity between centralized and decentralized venues.
Source review date: November 6, 2026. Market-share figures refer to CoinMarketCap Research’s September 2026 dataset covering 11 tracked exchanges, not the entire global derivatives market. Explanations of competitive mechanisms are analytical interpretations and do not establish the causes of individual exchange-level changes.
Editorial independence: This research is not a ranking or endorsement of any trading venue. No independent order-execution tests were conducted for this article.
Disclaimer: This article is for informational purposes only and does not constitute financial or investment advice. Cryptocurrency derivatives involve substantial risk, including leverage, liquidation, funding costs, and exchange-related risks.